 |
VOOZH | about |
|
VOOZH | about |
Support Vector Machines (SVM) are supervised learning models mainly used for classification and but can also be used for regression tasks. In this approach, each data point is represented as a point in an n-dimensional space where is the number of features. The goal is to find a hyperplane that best separates the two classes.
A Support Vector Machine (SVM) is a classifier that finds a separating hyperplane to differentiate between classes in the data. A hyperplane is a flat subspace that divides the feature space into two parts for classification tasks. In a two-dimensional space this is simply a line while in higher dimensions it becomes a plane or a hyperplane that separates the data into different categories.
Mathematically, the hyperplane can be represented as :
Where:
For classification SVM aims to maximize the margin between the classes. The margin is the distance between the hyperplane and the closest data points from each class known as support vectors. SVM chooses the hyperplane that maximizes this margin which is given by:
This ensures the largest possible separation between the classes while minimizing classification errors.
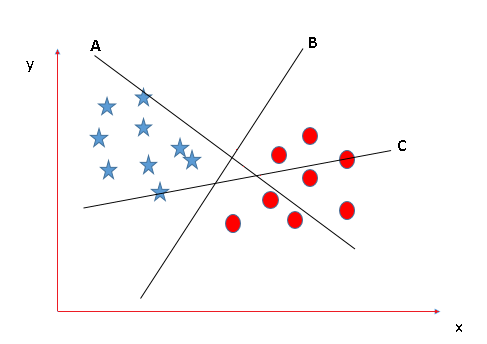
To determine the optimal hyperplane, algorithm analyzes labeled training data and evaluates different hyperplanes based on how well they separate the classes. Consider the following scenarios for selecting the best hyperplane:
In this case, we have three hyperplanes: A, B and C. The goal is to find the hyperplane that best separates the two classes i.e stars and circles. The rule here is to choose the hyperplane that best divides the classes. In this scenario hyperplane B does the best job at separating the two classes making it the optimal choice.
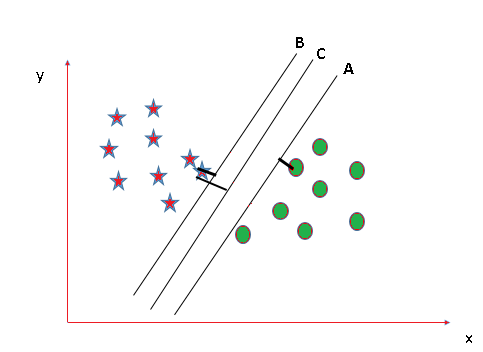
👁 ImageIn this situation all three hyperplanes A, B and C do a good job at separating the classes. To identify the best hyperplane we calculate the margin which is the distance between the nearest data points and the hyperplane. The hyperplane with the largest margin is considered the best as it provides better separation. Here hyperplane C has the largest margin making it the optimal choice.
👁 ImageWe are going to implement the SVM algorithm in R using following steps:
We need to install and load the e1071 package which contains the svm() function for training the model.
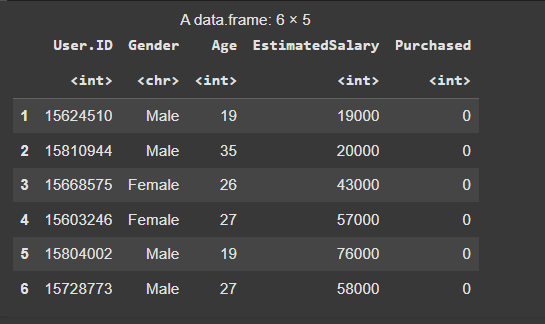
We will use this dataset of Social network ads from file Social.csv. We will read the dataset using read.csv() function and display the first 6 rows using the head() function.
Output:
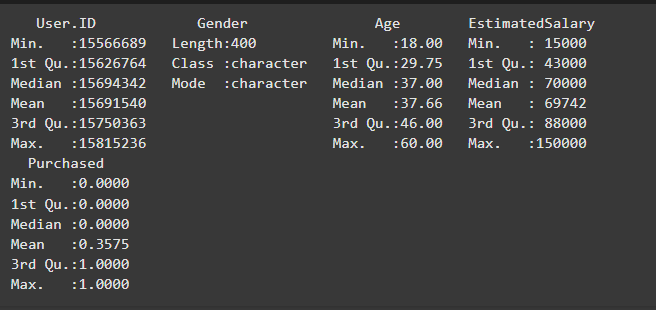
We will explore our dataset by using the summary() function which provides a statistical summary of the dataset including measures like minimum, maximum, mean and quartiles.
Output:
We need to prepare the data by encoding the categorical variable Gender and scaling the continuous features Age and EstimatedSalary.
Now, we will train the SVM model using the svm() function. The model will predict whether a user purchased the product (Purchased) based on the features Age, EstimatedSalary and Gender.
Once the model is trained we can use it to predict on the test set.
Output:
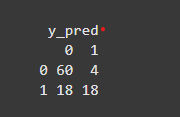
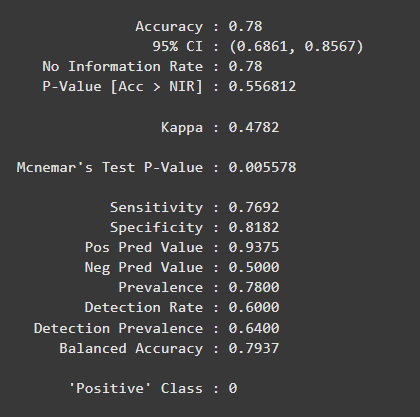
We evaluate the model’s performance using a confusion matrix, accuracy and other metrics like precision, recall, F1-score.
Output:
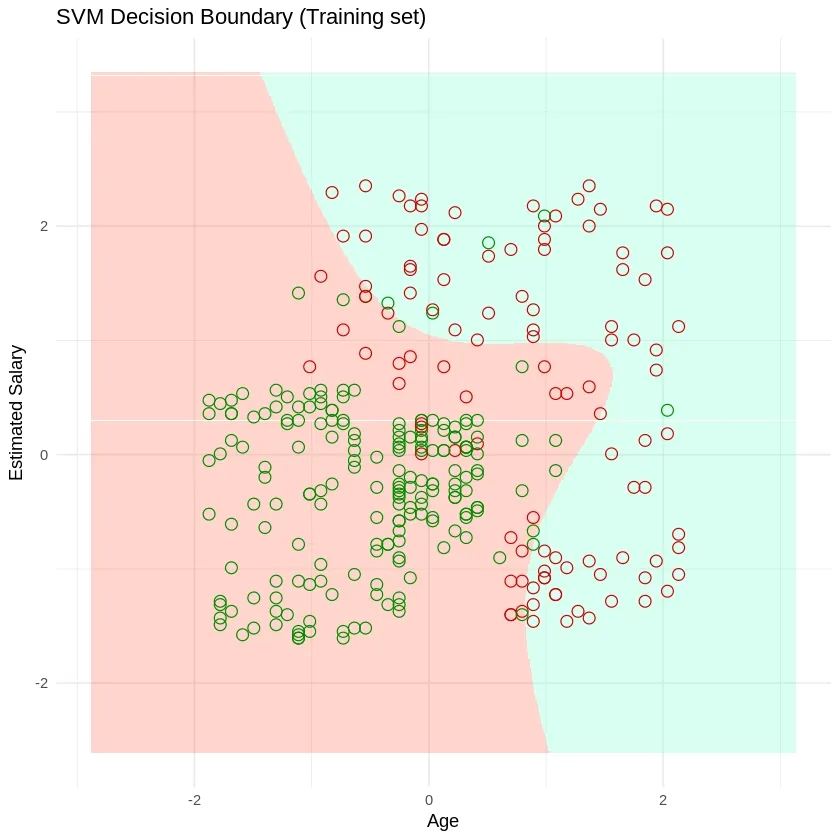
We can also visualize the decision boundary using ggplot2. Here ,
Output:
In this article we implemented SVM algorithm in R from data preparation and training the model to evaluating its performance using accuracy, precision, recall and F1-score metrics.