 |
VOOZH | about |
|
VOOZH | about |
K-Nearest Neighbor or KNN is a supervised non-linear classification algorithm. It is also Non-parametric in nature meaning , it doesn't make any assumption about underlying data or its distribution.
In KNN algorithm, K specifies the number of neighbors and its algorithm is as follows:
For the Nearest Neighbor classifier, the distance between two points is expressed in the form of Euclidean Distance.
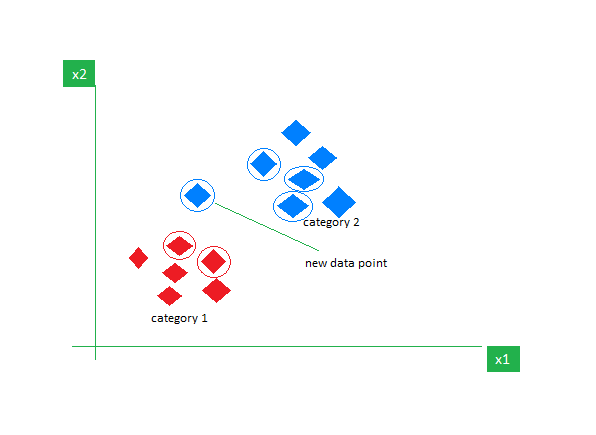
Consider a dataset containing two features Red and Blue and we classify them. Here K =5 meaning, we are considering 5 neighbors according to Euclidean distance.
👁 ImageSo, when a new data point enters, out of 5 neighbors, if 3 are Blue and 2 are Red, we assign the new data point to the category with most neighbors (in this case that will be Blue).
We will perform the K-Nearest Neighbor Algorithm in R programming language using the Iris dataset.
We will install the class package which can be used to fit a KNN model also caTools for splitting our dataset into training and testing.
We will use the Iris dataset which is a built in dataset in R programming language which contains 50 samples from each of 3 species of Iris(Iris setosa, Iris virginica, Iris versicolor). We will use the str() function to give us the feature names and structure of the dataset.
Output:
We first split the iris dataset into training and testing sets using a 70:30 ratio. Then, we scale the numeric feature columns (first 4) in both sets to normalize their values.
We fit a KNN model using the scaled training data, where k = 1. The model then predicts species labels for the test set based on the nearest neighbor from the training set. Also, the Classifier Species feature is fitted in the model.
We create a confusion matrix to compare the predicted labels with the actual species in the test set. This helps us evaluate how well the KNN model classified each species.
Output:
We test multiple values of k to find the most suitable one for our KNN model. For each k, we calculate the miss-classification error and print the corresponding accuracy. This helps in selecting a k that balances bias and variance for better model performance.
Output:
From the graph, we observe the following accuracy trends for different values of k:
Therefore, the optimal value of k for our model is 5.
In this article, we implemented the K-Nearest Neighbors (KNN) algorithm on the iris dataset and evaluated model accuracy across different values of k. We found that accuracy peaked at k = 5 and 7, demonstrating the importance of tuning k for optimal performance.