 |
VOOZH | about |
|
VOOZH | about |
Kolmogorov-Smirnov (K-S) test is a non-parametric test employed to check whether the probability distributions of a sample and a control distribution, or two samples are equal. It is constructed based on the cumulative distribution function (CDF) and calculates the greatest difference between the empirical distribution function (EDF) of the sample and the theoretical or empirical distribution of the control sample.
The Kolmogorov-Smirnov test is mostly used for two purposes:
- One-sample K-S test: To compare the sample distribution to a known reference distribution.
- Two-sample K-S test: To compare the two independent samples' distributions.
The K-S test is formulated on the basis of the maximum difference between the observed and expected cumulative distribution functions (CDFs). The test is non-parametric, as it does not assume any specific distribution for the sample data. This makes it especially helpful in testing the goodness-of-fit for continuous distributions.
The formula of the Kolmogorov-Smirnov test can be expressed as:
where,
The empirical distribution function is a distribution function that is associated with the empirical measures of the chosen sample. Being a step function, this cumulative distribution jumps up by a 1/n step at each and every n data point.
The K-S test can be performed using the ks.test() function in R.
Syntax:
ks.text(x, y, alternative = c("two.sided", "less", "greater"), exact= NULL, tol= 1e-8,
simulate.p.value = FALSE, B=2000)
Parameters:
First, install the required packages. For performing the K-S test we need to install the "dgof" package using the install.packages() function from the R console.
The rnorm() function is used to generate random variates.
Output
One-sample Kolmogorov-Smirnov test

data: x1
D = 0.08831, p-value = 0.4165
alternative hypothesis: two-sided
The two-sample K-S test is used to compare two samples to see whether they belong to the same distribution. The ks.test() function can also be used in R for this.
We will generate two random samples using rnorm() and runif(), then perform the two-sample K-S test. for this purpose, use the ks.test() of the dgof package.
Output
Two-sample Kolmogorov-Smirnov test

data: x and y
D = 0.56, p-value = 6.303e-06
alternative hypothesis: two-sided
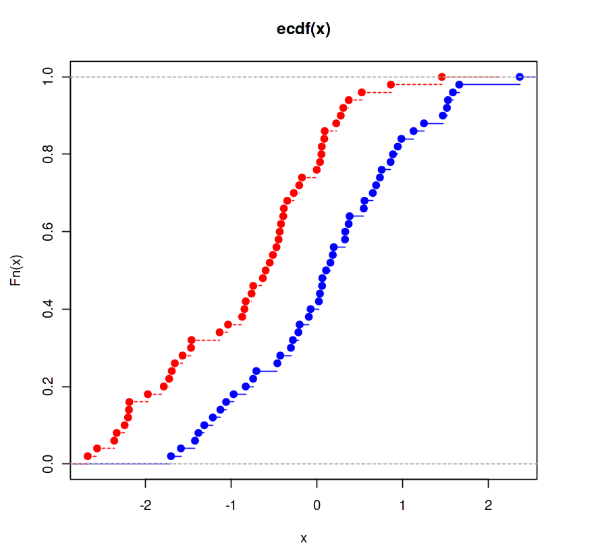
Visualization is a essential component of the K-S test because it allows us to visualize the difference between the cumulative distribution functions of the two samples. Here, we plot the empirical CDFs of two samples in order to visually check the difference.
Here we are generating both samples using the rnorm() functions and then plotting them.
Output:
Two-sample Kolmogorov-Smirnov test

data: x and x2
D^- = 0.4, p-value = 0.0003355
alternative hypothesis: the CDF of x lies below that of y
Related Article: