 |
VOOZH | about |
|
VOOZH | about |
K Means Clustering is an unsupervised learning algorithm that groups data into clusters based on similarity. This algorithm divides data into a specified number of clusters, assigning each data point to one. It is used in various fields like banking, healthcare, retail and media. In this article we will implement K Means Clustering in R Programming Language.
K Means Clustering is an iterative algorithm that divides data into K clusters, aiming to group data points that are similar to each other while minimizing the distance between them and their cluster's centroid. Below is a step-by-step breakdown of how the algorithm works and how it assigns data points to clusters:
We are going to perform to K-Means clustering on the Iris dataset in R.
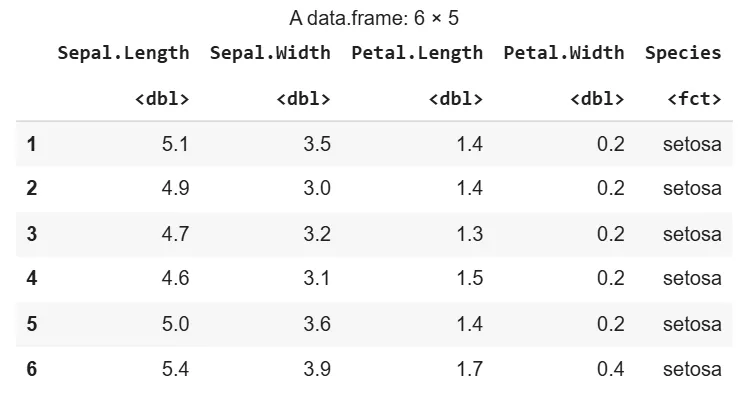
1. Importing the DatasetWe are loading the Iris dataset that contains measurements of Iris flowers' sepal and petal.
Output:
We are installing and loading the required packages for clustering and visualization. We are using "factoextra" for cluster visualization and "cluster" for clustering operations.
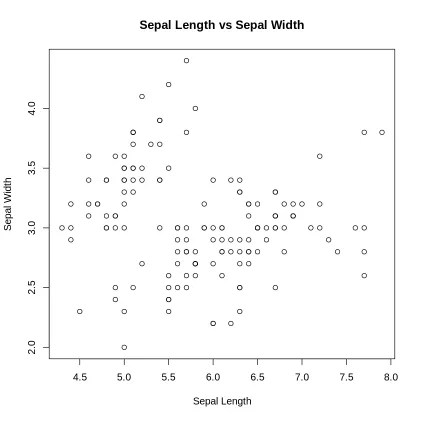
We are visualizing the Iris dataset using Sepal Length and Sepal Width to understand the distribution of data points.
Output:
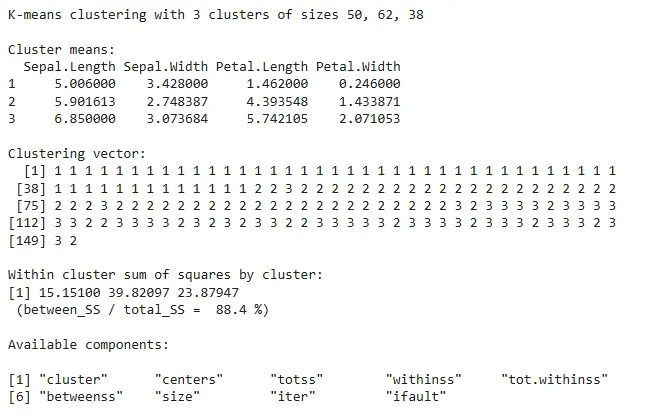
We are applying the K-Means clustering algorithm to the dataset and setting the number of clusters to 3 (corresponding to the 3 Iris species).
Output:
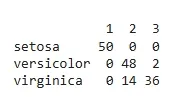
We are creating a confusion matrix to compare the actual species labels with the clusters predicted by K-Means.
Output:
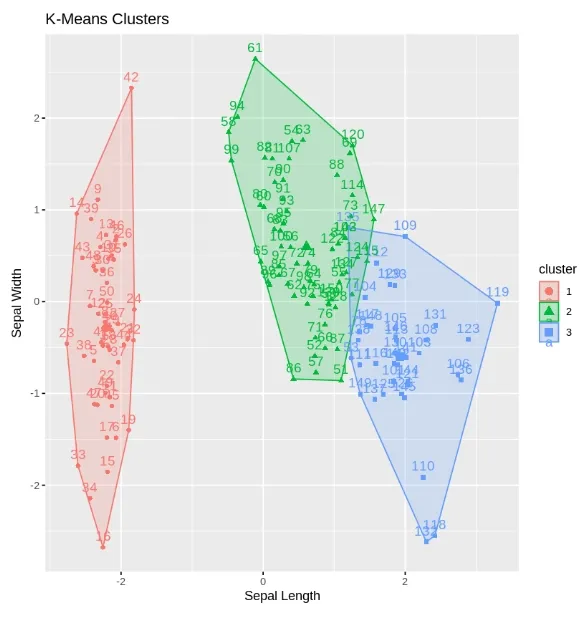
We are visualizing the clusters formed by K-Means using the factoextra package. This plot shows the clusters along with Sepal Length and Sepal Width.
Output:
This is a plot showing the three K-Means clusters based on Sepal Length and Sepal Width.