 |
VOOZH | about |
|
VOOZH | about |
In this tutorial series, we are going to cover Logistic Regression using Pyspark. Logistic Regression is one of the basic ways to perform classification (don’t be confused by the word “regression”). Logistic Regression is a classification method. Some examples of classification are:
We will be using the data for Titanic where I have columns PassengerId, Survived, Pclass, Name, Sex, Age, SibSp, Parch, Ticket, Fare, Cabin, and Embarked. We have to predict whether the passenger will survive or not using the Logistic Regression machine learning model. To get started, open a new notebook and follow the steps mentioned in the below code:
Output:
df.printSchema()
df.columns
The next step includes removing the data having null values as shown in the above picture. We do not need the columns PassengerId, Name, Ticket, and Cabin as they are not required to train and test the model.
Output:
The next task is to convert the string columns (Sex and Embarked) to integral columns as without doing this, we cannot vectorize the data using VectorAssembler.
Now we need Pipeline to stack the tasks one by one and import and call the Logistic Regression Model.
After pipelining the tasks, we will split the data into training data and testing data to train and test the model.
Output:
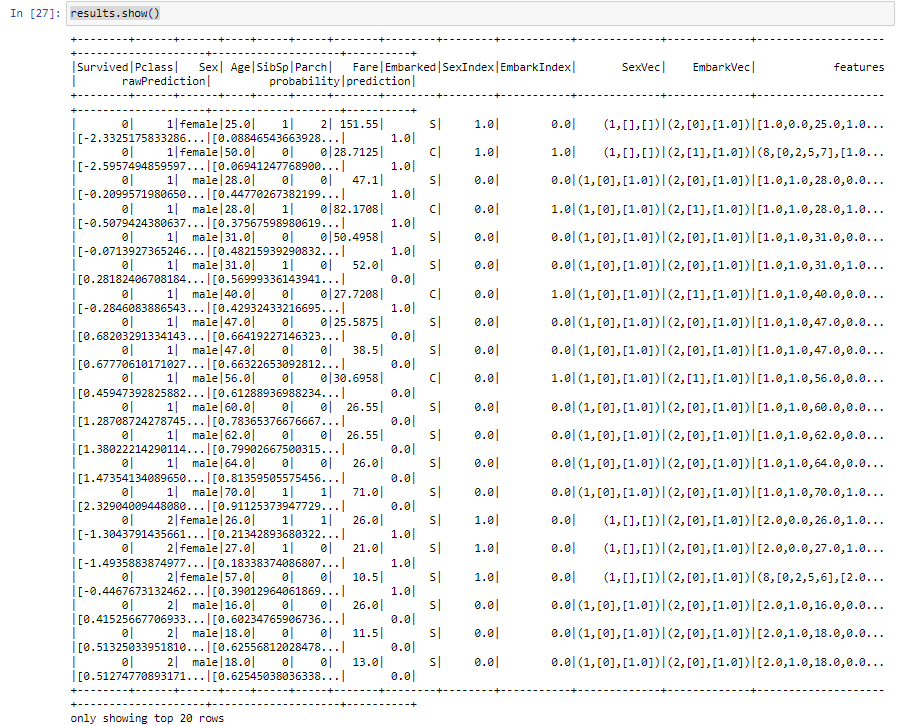
data.show()
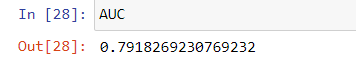
The results will add extra columns rawPrediction, probability, and prediction because we are transforming the results on our data. After getting the results, we will now find the AUC(Area under the ROC Curve) which will give the efficiency of the model. For this, we will use BinaryClassificationEvaluator as shown:
Output:
Note: In general, an AUC value above 0.7 is considered good, but it's important to compare the value to the expected performance of the problem and the data to determine if it's actually good.
ROC_AUC