 |
VOOZH | about |
|
VOOZH | about |
Customer churn occurs when a customer stops using a company’s service lead to revenue loss. Analyzing churn helps businesses understand why customers leave and how to improve retention. High churn rates can affect revenue and business growth. By analyzing churn patterns businesses can take proactive steps to retain customers.
In this guide we will explore the Telco Customer Churn dataset to predict churn effectively.
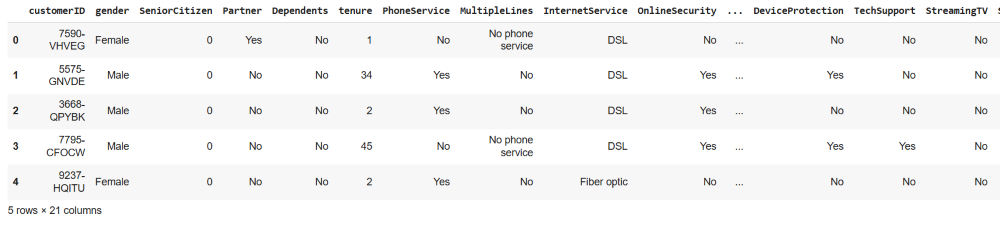
We start by importing the necessary Python libraries and loading the Telco Customer Churn dataset. This dataset contains various customer details such as service plans, usage behavior and churn status. You can download the dataset from here.
Output:
To gain insights into the dataset we first check for missing values and understand its structure. The dataset includes features such as:
Output:
👁 Screenshot-2025-03-13-214701We check the number of churners and non-churners to understand the balance of the dataset.
Output:
👁 Screenshot-2025-03-13-214920Before processing we ensure that all numerical columns contain valid values. The TotalCharges column sometimes has empty spaces which need to be converted to numerical values.
Some features like State, International Plan and Voice Mail Plan are categorical and must be converted into numerical values for model training.
We separate the features (X) and target variable (y) and split the dataset into training and testing sets.
Since features are on different scales we apply standardization to improve model performance. It prevents models from being biased toward larger numerical values and improves convergence speed in optimization algorithms like gradient descent
For training our model we use Random Forest Classifier. It is an ensemble learning method that combines the results of multiple decision trees to make a final prediction.
Output:
👁 randomforestclassifierTo measure model performance we calculate accuracy using the accuracy_score function.
Output:
Model Accuracy: 0.78
We evaluate precision, recall and accuracy using a confusion matrix.
Output:
👁 ImageConfusion matrix shows how well the model predicts customer churn. It correctly identifies 924 non-churners and 181 churners. However 117 non-churners are wrongly classified as churners and 187 churners are missed. The high number of missed churners suggests the model may need further tuning.