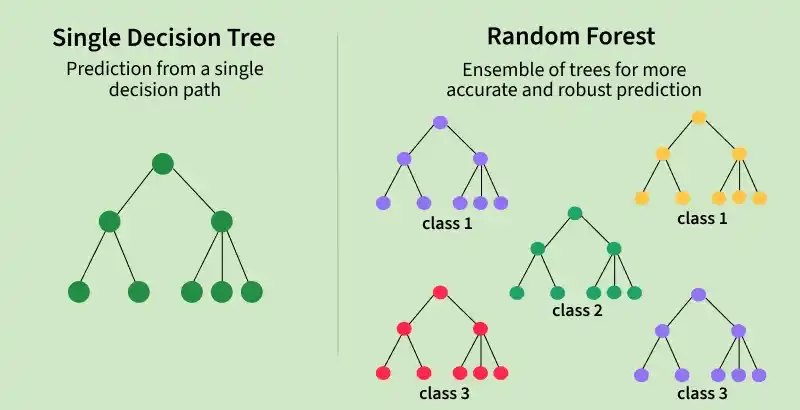
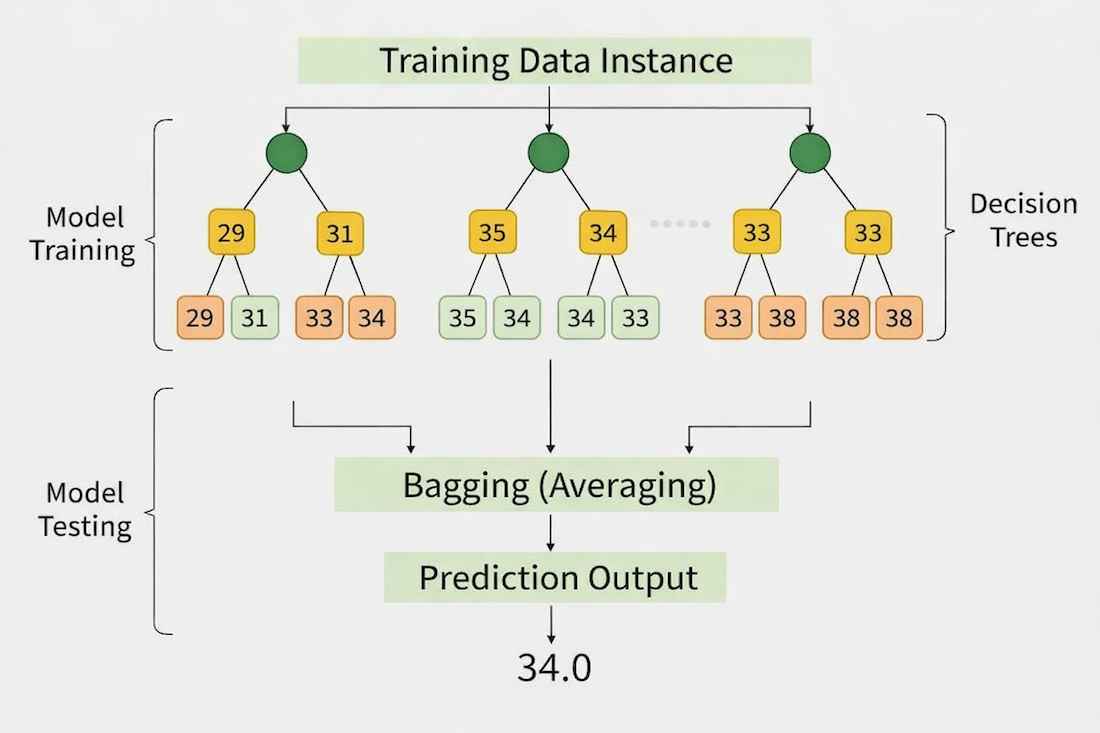
Random Forest is an ensemble learning method that combines multiple decision trees to produce more accurate and stable predictions. It can be used for both classification and regression tasks, where regression predictions are obtained by averaging the outputs of several trees.
Multiple decision trees: Builds many trees and combines their predictions.
Ensemble approach: Reduces errors compared to a single decision tree.
Regression prediction: Produces continuous values by averaging predictions from all trees.
Here the code will extracts two subsets of data from the Dataset and stores them in separate variables.
Extracting Features: It extracts the features from the DataFrame and stores them in a variable named X.
Extracting Target Variable: It extracts the target variable from the DataFrame and stores it in a variable named y.
4. Encoding categorical columns
If the dataset contains object type columns, they are converted into numeric form using Label Encoding so that the machine learning model can process them.
5. Splitting Dataset
The dataset is divided into training and testing sets so that the model is trained on one portion and evaluated on unseen data. This prevents overly optimistic performance results.
6. Random Forest Regressor Model
The model is trained using the training dataset.
n_estimators=100: Number of decision trees in the forest.
random_state=42: Ensures reproducible results.
oob_score=True: Uses out-of-bag samples to estimate model performance.
7. Making predictions and Evaluating
The code evaluates the trained Random Forest Regression model:
oob_score_: Retrive out-of-bag (OOB) score which estimates the model's generalization performance.
Predictions are made on the test set.
Evaluates the model's performance using the Mean Squared Error (MSE) and R-squared (R2) metrics.
Output:
Out-of-Bag Score: 0.2280694384742593 Mean Squared Error: 616145000.0 R-squared: 0.9878292345679013
Out-of-Bag Score: Measures how well the model generalizes on unseen samples, a low value indicates weaker generalization.
Mean Squared Error: Average squared difference between actual and predicted values, lower values indicate better predictions.
R-squared: Indicates how much variance in the target variable is explained by the model, values close to 1 show a strong fit.
8. Visualizing
Now let's visualize the results obtained by using the RandomForest Regression model on our salaries dataset.
Creates a grid of prediction points covering the range of the feature values.
Plots the real data points as blue scatter points.
Plots the predicted values for the prediction grid as a green line.
Adds labels and a title to the plot for better understanding.
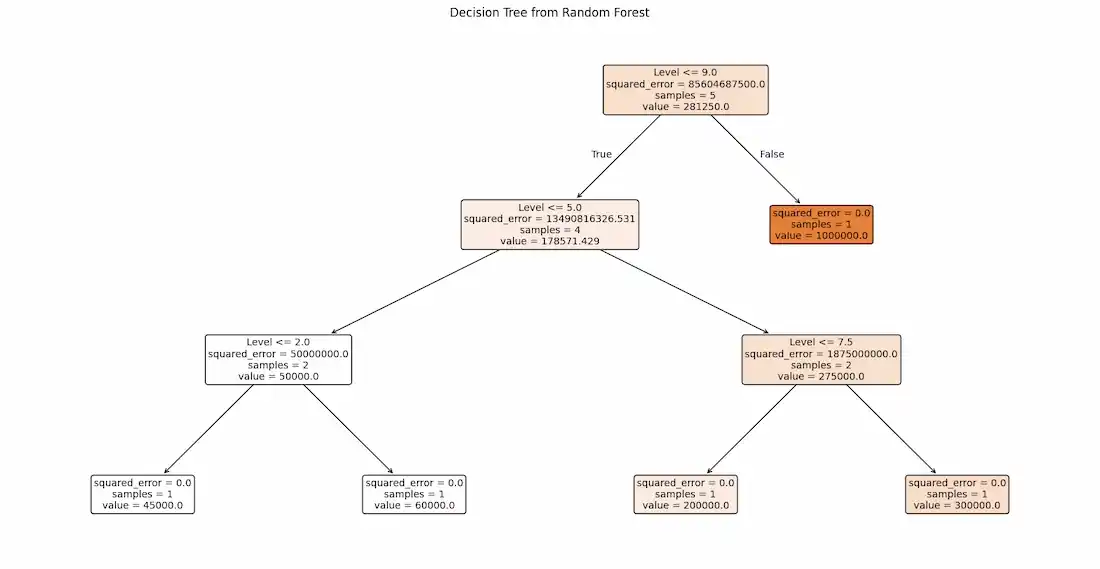
The code visualizes one of the decision trees from the trained Random Forest model. Plots the selected decision tree, displaying the decision making process of a single tree within the ensemble.
Output:
👁 downloa Single Decision Tree from the Random Forest Model
