 |
VOOZH | about |
|
VOOZH | about |
Surface plots and contour plots are visualization tools used to represent three-dimensional data in two dimensions. They are commonly used in mathematics, engineering and data analysis to understand the relationships between three variables. In this article, we will understand about surface and contour plots in Python
It is a representation of three-dimensional dataset and it describes a functional relationship between two independent variables X and Z and a dependent variable Y. It shows overall shape of data and make it easy to see the trend behind the data. They are used to:
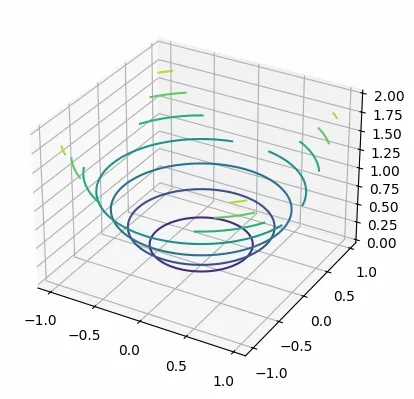
To create a 3D surface plot in Python we use the plot_surface() function from matplotlib 3D module. Syntax is:
ax.plot_surface(X, Y, Z)
where X and Y are 2D arrays of points while Z is a 2D array of heights. Now let' see how to create a simple surface plot in python:
Output:
Contour plots also known as level plots which are a way to represent three-dimensional data into two dimensions. Instead of showing data points it show "contours" or "levels" of constant values. These plots are useful for visualizing things like density, altitude or temperature at different points on a plane. They are widely used in fields like:
To create a contour plot, we use the contour() function which works when Z= f(X,Y). This means that the height (Z) depends on the values of X and Y. The syntax is as follows:
matplotlib.pyplot.contour(X, Y, Z, [levels], **kwargs)
Where:
Z contains the height values over which the contour lines are drawnLet's see how to create contour plot using matplotlib.
Output:
In summary both surface plots and contour plots are valuable tools for visualizing three-dimensional data. Surface plots help us to see the shape of the data while contour plots provide a clear view of data relationships in two dimensions