 |
VOOZH | about |
|
VOOZH | about |
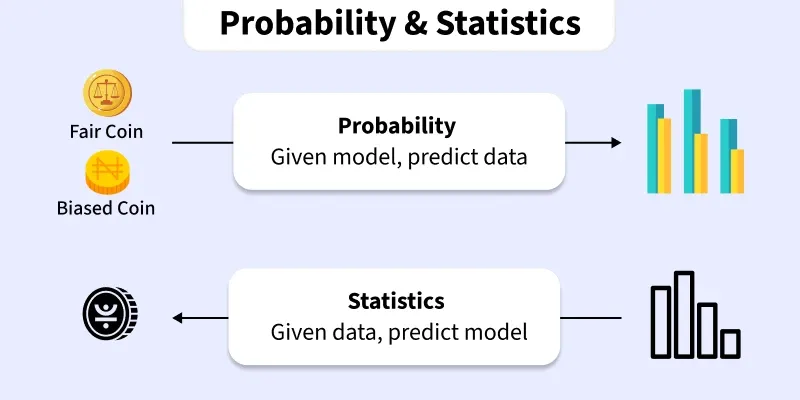
Probability and Statistics are important topics when it comes to studying numbers and data. Probability helps us figure out how likely things are to happen, like guessing if it will rain. On the other hand, Statistics involves collecting, analyzing, and interpreting data to draw meaningful conclusions, like looking at numbers to learn useful things. Together, they help us make smart decisions and see patterns in the information around us.
Probability is a measure of the likelihood or chance of an event occurring.
In simple terms, it quantifies the likelihood of an outcome in a given set of circumstances, providing a basis for making informed predictions and decisions in various fields, including mathematics, statistics, and everyday life.
Statistics is the branch of mathematics that involves the collection, analysis, interpretation, presentation, and organization of data.
Statistics helps to quantify uncertainty and variation in data, enabling researchers, analysts, and decision-makers to draw meaningful conclusions and make informed decisions.
Some of the common formulas of Probability and Statistics are discussed below:
Probability is the likelihood of an event occurring and is calculated using the following formula:
P(A) = Number of Favourable Outcomes / Total Number of Possible Outcomes
Where:
In simple terms, probability is the ratio of successful outcomes to all possible outcomes. The result is a number between 0 (impossible event) and 1 (certain event). It can also be expressed as a percentage by multiplying the result by 100.
For example, if you want to find the probability of rolling a 4 on a six-sided die, there is 1 favorable outcome (rolling a 4) out of 6 possible outcomes (1, 2, 3, 4, 5, 6). Therefore,
P(rolling a 4)= 1/6
The addition rule of probability is used to find the probability that at least one of two events occurs.
If events A and B are mutually exclusive (they cannot happen at the same at same time), then the probability of either event A or event B occurring is:
P(A or B) = P(A ∪ B) = P(A) + P(B) - P(A ∩ B) ( If A and B are not mutually exclusive events)
where P(A ∩ B) is the probability of A and B occurring.
P(A or B) = P(A ∪ B) = P(A) + P(B), ( If A and B are mutually exclusive events)
The multiplication rule of probability is used to find the probability of two events occurring together.
- If events A and B are independent(they do not affect each other), then:
P(A ∩ B)=P(A)×P(B)- If events A and B are dependent( the occurrence of A affects the occurrence of B), then:
P(A ∩ B)=P(A)×P(B∣A)
Here, P(B∣A) is the likelihood of event B happening when event A has already occurred.
Bayes' Rule is a formula used to update probabilities based on new evidence. It calculates the probability of an event A happening given the occurrence of another event B. The formula is as follows:
Here:
Some of the common formulas for statistics are discussed below:
The mean is the average of a set of numbers. To find the mean, add up all the numbers in a dataset and then divide by the total number of values.
Mean = Sum of all values / Total number of values
Where,
The median is the middle value in a dataset when it's arranged in ascending or descending order. If there's an even number of values, the median is the average of the two middle numbers.
Median (Odd n)
Median = Value at th position
Median (Even n)
Where,
The mode is the value that appears most frequently in a dataset. A dataset may have one mode (unimodal), more than one mode (multimodal), or no mode at all.
Variance measures how spread out the values in a dataset are. It's calculated by finding the average of the squared differences between each value and the mean.
Variance= ∑(Each value−Mean) 2 / Total number of values
OR
Where,
Standard deviation is the square root of the variance. It provides a more interpretable measure of how spread out the values are in comparison to the mean.
Standard Deviation = √Variance
OR
Where,
Some important topics under both Probability and Statistics are discussed below:
The various types of events in probability are:
A simple event is when an outcome has just one possibility.
Example: In a coin flip, getting heads is a simple event, and getting tails is another.
P(Simple Event) = 1 / Total Possible Outcomes
A compound event involves two or more simple events.
For Example, flipping a coin twice and getting heads both times.
P(Compound Event) = P(Event 1) × P(Event 2)
Independent events are events where the outcome of one does not affect the outcome of the other.
Example: Each flip of fair coin is independent- getting heads once doesn't change the chance of getting head again.
Dependent events are those where outcomes of another.
Example: Drawing a marble from a bag without replacement- the second draw is affected by the first.
A complementary event is the opposite of a given event. The complement of event A(denoted as A') includes all outcomes not in A.
Example: IF an event of rolling an even number on a six-sided die, then A' is rolling an odd number.
P(Not A) = 1−P(A)
A probability distribution describes how the probabilities of different outcomes are spread across the possible values of a random variable. It provides a comprehensive view of the likelihood of each possible outcome, helping to understand the uncertainty associated with random events. There are two main types of probability distributions:
Probability functions provide mathematical representations of the probabilities associated with different values of a random variable. Two common types are Probability Mass Functions (PMFs) for discrete variables and Probability Density Functions (PDFs) for continuous variables.
Some of the key topics of statistics are:
Descriptive statistics is a branch of statistics focused on summarizing data, presenting it in various forms like graphs or tables. It involves using summary statistics to provide a clear understanding of the data. A descriptive statistic serves as a condensed representation of data. Following are the examples of descriptive statistics given below.
Central Tendency of a set of data is measured by the following methods
- Mean: The average of a set of values. Add up all values and divide by the number of values.
- Median: The middle value when data is arranged in order.
- Mode: The most frequently occurring value in a dataset.
Example: For test scores of 80, 85, 90, 92, and 95, the mean is (80+85+90+92+95)/5 = 88, the median is 90, and the mode is not applicable as there is no repeated value.
Standard Deviation: Indicates how spread out the values are from the mean.
Variance: The average of the squared differences from the mean.
Example: In two sets of scores, 70, 75, 80, 85, and 90, and 60, 65, 70, 75, and 80, both have a mean of 80, but the second set has a higher variance, showing more variability.
In practical situations, collecting data from entire populations is often challenging. Descriptive statistics provide a solution by summarizing and organizing available data to offer insights. For instance, calculating the mean (average) and standard deviation from a sample can provide a snapshot of the central tendency and variability in a dataset.
However, when population-scale data collection is impractical, inferential statistics come into play. They involve concluding entire populations based on samples. For example, if estimating the mean score of all U.S. high school students on the AP Physics exam is too extensive, inferential statistics enable drawing reliable conclusions from a manageable sample. This approach facilitates informed decision-making even when exhaustive data collection is unfeasible.
Data representation involves the presentation of information in a meaningful and understandable manner. In statistics, this is crucial for analyzing and interpreting data effectively. Common methods of data representation include:
Methods of sampling are used to select a subset of individuals or items from a larger population for the purpose of making inferences about the population. Different sampling techniques are employed based on the nature of the study and the characteristics of the population. Here are some common sampling techniques:
Probability and Statistics form a crucial part of engineering mathematics, offering a foundation for making informed decisions and solving complex engineering problems. Here's a brief overview of how these mathematical fields apply to engineering:
Example 1: Consider the following dataset: [5, 8, 2, 5, 3, 7, 9]. Calculate the mean, median, and mode.
Solution:
Mean =
= [5+8+2+5+3+7+9] / 7
⇒ 39/7 = 5.579Median:
The number of values in data set is 7, which is odd n
by arranging the values in ascending order [2, 3, 5, 5, 7, 8, 9].
The median is the 4th value, which is 5.Mode: The mode is 5, as it appears more frequently than any other number in the dataset.
Example 2: Given the dataset [12, 15, 18, 22, 25], calculate the variance and standard deviation.
Solution:
The given data set is [12, 15, 18, 22, 25]
Mean =
⇒ = sum of all values / total number of values
⇒ = (12+15+18+22+25) / 5
⇒ 92/5
⇒ 18.4Now,
Variance = Variance= ∑(Each value−Mean) 2 / Total number of values
⇒ σ2 = [(12−18.4)2 + (15−18.4)2 + (18−18.4)2 + (22−18.4)2 + (25−18.4)2 ] / 5
⇒ [41.64 + 11.56 + 0.16 + 13.44 + 43.56] /5
⇒ 110.36 /5
⇒ 22.072We know,
Standard deviation = √σ2
⇒ √22.072
√σ2= 4.69
Example 3: In a deck of cards, what is the probability of drawing a red card?
Solution:
Total number of cards in a deck = 52
Total number od Red cards in a deck = 26 (hearts + diamonds)P(Red Card) = 52/26
⇒ P(Red Card) = 2/4
⇒ P (Red Card) = 1/2 or 0.5 or 50%
Example 4: A box contain 3 red balls, 2 green balls, and 5 blue balls. One ball is drawn at random. what is the probability the the ball drawn is red, green and not blue?
Solution:
Total number of balls = 3(Red) + 2( Green) + 5 (Blue) = 10
- P(Red) = Number of red balls/ Total balls =3/10
- P(Green) = Number of green balls/ Total balls = 2/10 = 1/5
- p(Not Blue) = Number of non-blue balls(Red + Green)/Total balls = 3 + 2/10 = 5/10 = 1/2
Example 5: A company has 6 departments, and the number of employees in each department is as follows: 25, 30, 28, 32, 35,40. Find the population mean of number of employees.
Solution:
The population mean 𝛍 is calculated by :
𝛍 = Sum of the values in the population / Number of values in the population
𝛍 = 25 + 30 + 28 + 32 + 35 + 40 / 6 = 190/6 = 31.67
Problem 1: A bag contains 5 red marbles, 4 blue marbles, and 3 green marbles. What is the probability of randomly selecting a blue marble?
Problem 2: A survey is conducted on a sample of 100 people to estimate the average time spent daily on a mobile phone. The sample mean is 2.5 hours with a standard deviation of 1 hour. Calculate a 95% confidence interval for the population mean.
Problem 3: A fair six-sided die is rolled. What is the probability of rolling an even number or a number greater than 4?
Problem 4: Data Set: [8, 12, 15, 18, 10]. Calculate the variance and standard deviation.
Problem 5: Data Set: [10, 15, 12, 18, 15, 22, 20]. Find the mean, median, and mode of the given data set.