 |
VOOZH | about |
|
VOOZH | about |
In this article, you will understand to connect node.js code with chrome dev tools. Here will start first understanding Devtools and Chrome and continue with the steps to connect Node.js with Chrome Devtool.
Chrome dev tools: Chrome DevTools is a set of web developer tools built directly into the Google Chrome browser which lets you inspect the DOM and network activity of your web pages.
Node.js: Node.js is a javascript runtime engine built on Chrome's V8. It is used for server-side programming and basically deployed for non-blocking, event-driven servers, such as static websites and back-end API services.
The problem with node JS is inflexible debugging options. In node, you can test the code only by consoling it on the CLI which makes it very difficult for us to log bigger messages or object structure, you cannot even profile the CPU or heap memory. To solve this problem you can make use of chrome DevTools. Nodejs provides a way to connect your scripts with chrome. The approach for the same is explained below:
Approach to Use Chrome dev tools for node.js:
Step 1: Download and install NODE.JS following this
Step 2: Run node with the --inspect flag on CLI
$ node --inspect index.js
Note: Use --inspect-brk to add line breakpoints
$ node --inspect-brk index.js
Step 3: Next, open chrome and type about:inspect on the address bar. It’ll redirect you to chrome://inspect
Step 4: Click the Open dedicated DevTools for Node link. It takes you to the dev tools.
About Inspect: This is the way to the DevTools page it consists of some options like:
About devtools: The devtools contains 5 tabs:
1. Connection: Here you can add the connection address like localhost:9229 where you are running your node script.
2. Console: To log debugging, warning, or error messages. This tab is like a command prompt. It consists of Options like:
3. Sources: Your script and debugging options. Here you can run a script and debug with breakpoints. It consists of :
4. Memory: To perform memory-related operations. You can find the amount of heap memory used by your node script. It consists of options like:
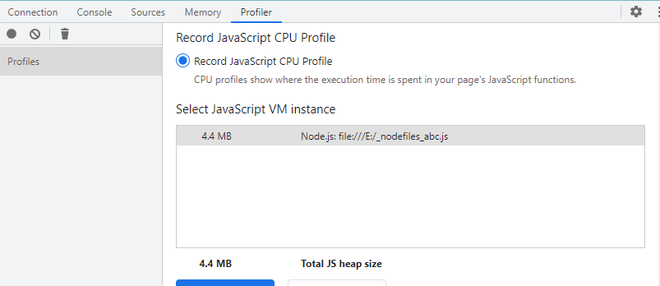
5. Profiler: To inspect the project performance. It has one option which is Record JS CPU Profile which shows the execution time spent in your page's JS functions.
Application: Now, you have all the chrome debugging features for Nodejs as well. Like:
Now, you need not depend on the CLI to debug your Javascript Project. With this flexible Chrome, you can profile your project very well and quickly.