 |
VOOZH | about |
|
VOOZH | about |
In data science K-Means clustering is one of the most popular unsupervised machine learning algorithms. It is primarily used for grouping similar data points together based on their features which helps in discovering inherent patterns in the dataset. In this article we will demonstrates how to apply K-Means clustering to test data in Python using OpenCV library.
K-Means clustering is an iterative algorithm that divides data into a predefined number of clusters (K) by partitioning data into K clusters based on feature similarities. It works by minimizing the variance within each cluster ensuring that data points within the same cluster are as similar as possible. The algorithm iteratively assigns data points to the nearest centroid, recalculates the centroids and continues this process until convergence.
Steps involved in K-Means clustering:
K-Means clustering helps in test data analysis by grouping similar tests based on features like test scores, difficulty levels, or time taken to solve. By clustering tests, one can gain insights into:
OpenCV provides an efficient implementation of the K-Means algorithm through its cv2.kmeans() function. This function allows us to cluster data points into predefined groups based on their features making it an ideal choice for analyzing test data. By this we can do fast and optimized clustering. Here is the step by step implementation.
We will be using numpy, pandas and OpenCV for this.
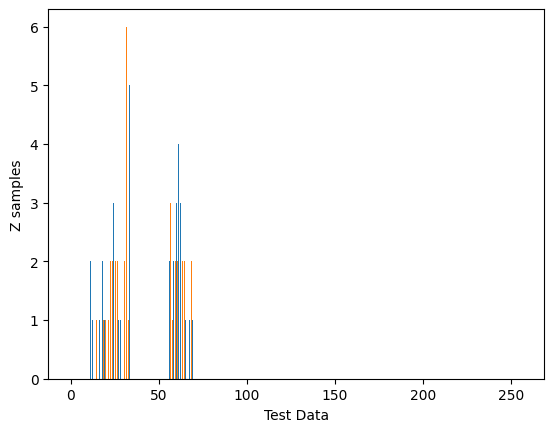
Let’s start by generating and visualizing random test data using matplotlib. In this case we create two sets of data points X and Y and visualize them as a histogram.
X and 55 and 70 for Y, both with dimensions (25, 2).X and Y arrays into a single array Z.Z array into a 50x2 array adjusting the dimensions accordingly.Z to 32-bit floating-point type for better compatibility with some functions especially in libraries like OpenCV.Output:
It shows two distinct clusters of data, with peaks indicating higher frequencies of test data points in specific ranges. The color-coded bars represent different data sets or clusters, and this distribution helps identify patterns in the data, which K-Means clustering can further analyze by grouping similar data points together.
Now let’s apply the K-Means clustering algorithm to the test data and observe its behavior.
Z (dataset), the number of clusters (2 in this case) and various parameters like the criteria, maximum iterations and the initialization method (KMEANS_RANDOM_CENTERS).A.B.Output:
The plot clearly shows that the K-Means algorithm has successfully grouped the data points into two distinct clusters, with the centroids positioned around the center of each group.
K-Means clustering is a useful unsupervised machine learning technique especially in applications such as test data analysis. By grouping similar test data points together you can easily identify patterns and trends that provide valuable insights. Although the algorithm is simple and effective it has limitations such as sensitivity to the choice of initial centroids and the requirement for predefining the number of clusters (K).