 |
VOOZH | about |
|
VOOZH | about |
The histogram is a graphical representation of data. We can represent any kind of numeric data in histogram format. In this article, We are going to see how to create a cumulative histogram in Matplotlib
Cumulative frequency: Cumulative frequency analysis is the analysis of the frequency of occurrence of values. It is the total of a frequency and all frequencies so far in a frequency distribution.
Example:
X contains [1,2,3,4,5] then the cumulative frequency for x is [1,3,6,10,15].
Explanation:
[1,1+2,1+2+3,1+2+3+4,1+2+3+4+5]
In Python, we can generate a histogram with dataframe.hist, and cumulative frequency stats.cumfreq() histogram.
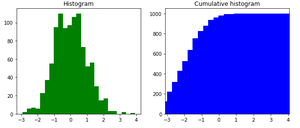
Example 1:
Output:
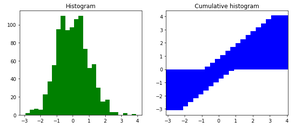
Example 2:
Output: