 |
VOOZH | about |
|
VOOZH | about |
In this article, we will learn different ways to create subplots of different sizes using Matplotlib. It provides 3 different methods using which we can create different subplots of different sizes.
Methods available to create subplot:
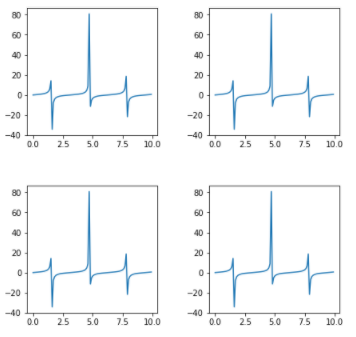
The GridSpec from the gridspec module is used to adjust the geometry of the Subplot grid. We can use different parameters to adjust the shape, size, and number of columns and rows.
gridspec.GridSpec(ncols=2, nrows=2, width_ratios=[2, 1],wspace=0.5,hspace=0.5,height_ratios=[1,2])
Output:
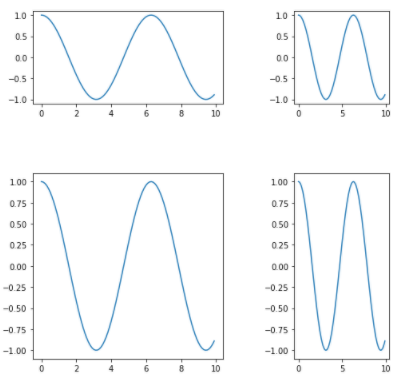
It is a dictionary available inside "plt.subplots()" method in Matplotlib. By passing different parameters to the dictionary we can adjust the shape and size of each subplot.
plt.subplots(nrows=2, ncols=2,figsize=(7,7), gridspec_kw={'width_ratios': [3, 3], 'height_ratios': [3, 3], 'wspace' : 0.4, 'hspace' : 0.4})
Code :
Output :
It provides more flexibility to create a grid at any location. We can extend the grid horizontally as well as vertically very easily. Here shape is denoting to no. of rows and columns and loc denotes the geometric location of the grid. Whereas, colspan = 3 in ax1, it means this subplot will cover 3 of all columns of that row. If we give irregular input then it will give an error so we have given the proper value to colspan and rowspan.
plt.subplot2grid(shape=(3, 3), loc=(0, 0), colspan=3)