 |
VOOZH | about |
|
VOOZH | about |
Prerequisites: Matplotlib
Scatter plots are the data points on the graph between x-axis and y-axis in matplotlib library. The points in the graph look scattered, hence the plot is named as 'Scatter plot'. The points in the scatter plot are by default small if the optional parameters in the syntax are not used. The optional parameter 's' is used to increase the size of scatter points in matplotlib. Discussed below are various ways in which s can be set.
Syntax :
matplotlib.pyplot.scatter(x_axis_data, y_axis_data, s=None, c=None, marker=None, cmap=None, vmin=None, vmax=None, alpha=None, linewidths=None, edgecolors=None)
Parameters:
- x_axis_data- An array containing x-axis data
- y_axis_data- An array containing y-axis data
- s- marker size (can be scalar or array of size equal to size of x or y)
- c- color of sequence of colors for markers
- marker- marker style
- cmap- cmap name
- linewidths- width of marker border
- edgecolor- marker border color
- alpha- blending value, between 0 (transparent) and 1 (opaque)
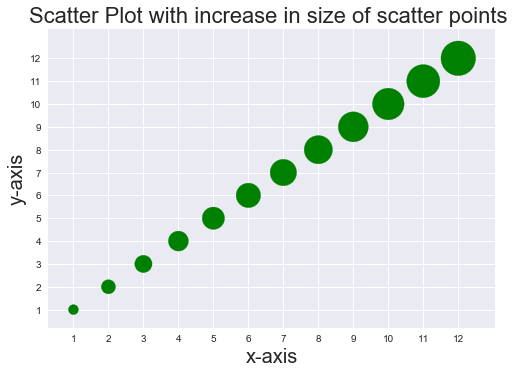
The parameter s can be set in multiple ways, it can be fixed value and it can also be a variable. When s is set to a variable values, data points on the scatter plot are of different sizes. Implementation is given below:
Example 1: Data points in scatter plot with an increased fixed size
Output:
👁 ImageExample 2: Data points in scatter plot with variable size
Output:
👁 ImageExample 3: