 |
VOOZH | about |
|
VOOZH | about |
Prerequisite:Matplotlib
Matplotlib is one of the most widely used data visualization libraries in Python. It provides a variety of ways to create high-quality 2D plots. One important aspect of making plots readable and aesthetically pleasing is formatting tick labels, including adjusting their font size. In this article, we will explore different methods to change the font size of tick labels in Matplotlib.
Table of Content
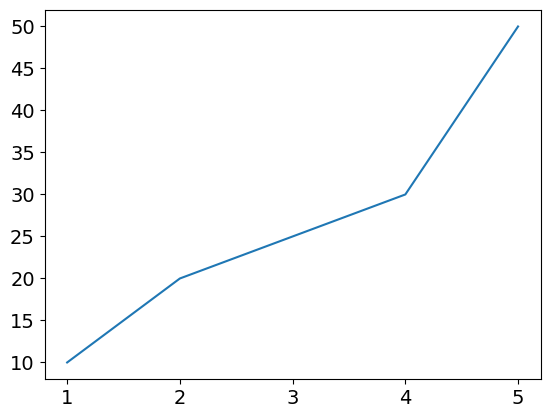
A simple and direct method to change the font size of tick labels is by using the fontsize parameter in plt.xticks() and plt.yticks(). This method is useful when you want to set the font size without modifying other tick properties.
Output
Explanation: After plotting the data using plt.plot(x, y), it customizes the font size of tick labels on both the x-axis and y-axis using the fontsize parameter in plt.xticks(fontsize=12) and plt.yticks(fontsize=12).
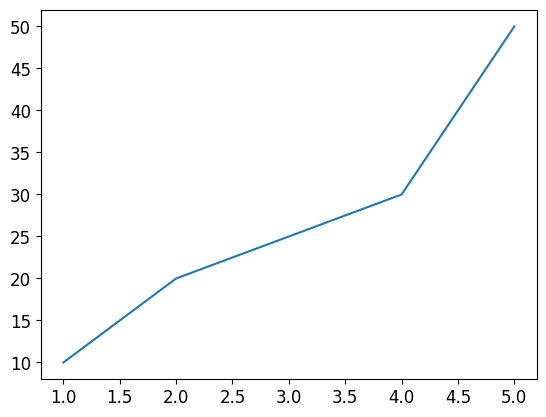
tick_params() method allows more fine-grained control over tick label appearance. It enables you to specify font size separately for major and minor ticks. This method is useful when working with both major and minor ticks and needing different sizes for each.
Output
Explanation: After plotting the data using ax.plot(x, y), it customizes tick label font sizes with ax.tick_params(), applying labelsize=14 for major ticks and labelsize=10 for minor ticks on both axes using axis='both'.
This approach provides greater flexibility by individually modifying each tick label. By iterating over get_xticklabels() and get_yticklabels(), you can apply specific styling to each label, making it useful when dealing with customized tick label formatting.
Output
Explanation: After plotting the data, it customizes tick label font sizes individually by iterating over ax.get_xticklabels() and ax.get_yticklabels(), setting fontsize=12 for each label to ensure consistent readability on both axes.
If you want to apply the same font size setting across multiple plots without repeatedly specifying it, using rcParams is the best approach. It modifies the default Matplotlib settings, making it useful when maintaining consistency in multiple figures.
Output
Explanation: After plotting the data, it sets the font size of tick labels globally using mpl.rcParams, where 'xtick.labelsize' and 'ytick.labelsize' are set to 12.