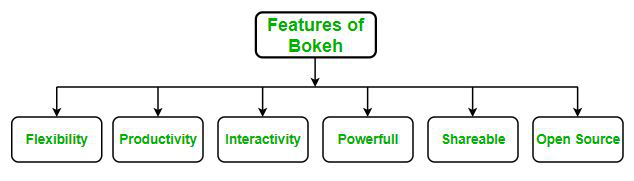
Bokeh is a Python interactive data visualization. Unlike Matplotlib and Seaborn, Bokeh renders its plots using HTML and JavaScript. It targets modern web browsers for presentation providing elegant, concise construction of novel graphics with high-performance interactivity.
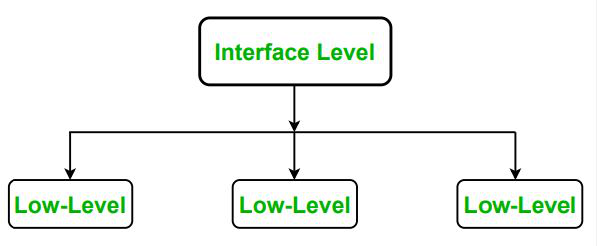
Bokeh is a powerful Python library used to create interactive and beautiful visualizations for the web. It provides two main interfaces depending on your needs:
High-Level Interface: bokeh.plotting
This is the most commonly used and beginner-friendly interface. It's designed to help you quickly create standard plots using simple methods.
Key Tool: figure()
Add visual elements (called glyphs) using .line(), .circle(), .bar(), etc.
Perfect for: Line charts, bar charts, scatter plots, etc.
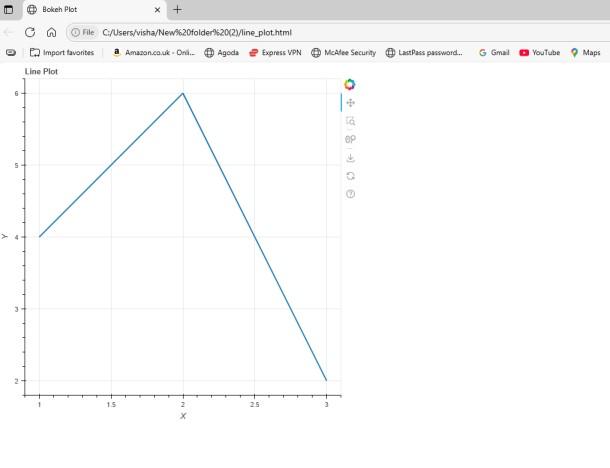
output_file("line_plot.html") sets the output file where the plot will be saved and opened in your browser.
figure() sets up the plot with a title and axis labels and p.line(...) draws a line using given x and y values.
show(p) opens the saved HTML file to display the interactive line chart.
Low-Level Interface: bokeh.models
This interface is for advanced users who need full control over the visualization.
You can customize everything: layout, interactions, callbacks, data sources and more.
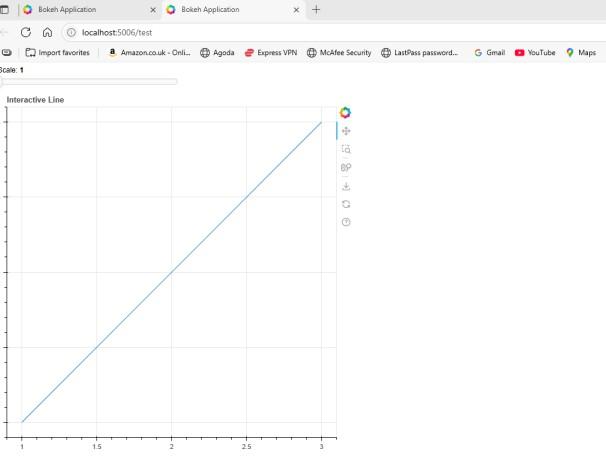
Adding Interactivity with Widgets
Bokeh makes it easy to build interactive apps using built-in UI components such as Slider, Button, Select (dropdown), TextInput and CheckboxGroup. These widgets allow users to dynamically interact with your plots, enabling real-time updates and a more engaging data exploration experience.
