 |
VOOZH | about |
|
VOOZH | about |
Matplotlib is a library in Python and it is numerical – mathematical extension for NumPy library. The Artist class contains Abstract base class for objects that render into a FigureCanvas. All visible elements in a figure are subclasses of Artist.
The findobj() method in artist module of matplotlib library is used to return find artist objects.
Syntax: Artist.findobj(self, match=None, include_self=True)
Parameters: This method accepts the following parameters.
- match : This parameter is the filter criterion for the matches. It default value is None.
- include_self : This parameter include self in the list to be checked for a match.
Returns: This method return artists(list of Artist).
Below examples illustrate the matplotlib.artist.Artist.findobj() function in matplotlib:
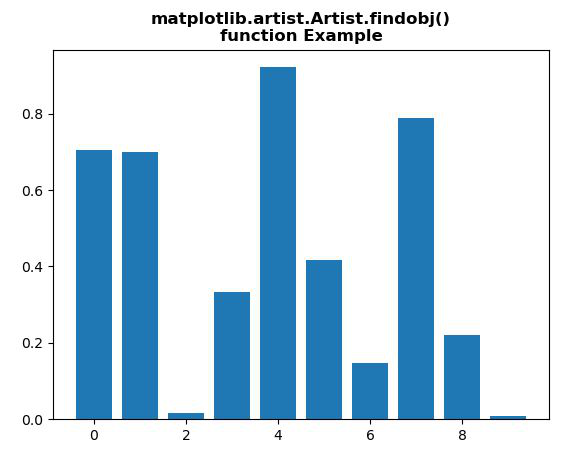
Example 1:
Output:
👁 ImageValue return : Rectangle(xy=(-0.4, 0), width=0.8, height=0.705031, angle=0) Rectangle(xy=(0.6, 0), width=0.8, height=0.698788, angle=0) Rectangle(xy=(1.6, 0), width=0.8, height=0.0159568, angle=0) Rectangle(xy=(2.6, 0), width=0.8, height=0.332931, angle=0) Rectangle(xy=(3.6, 0), width=0.8, height=0.921611, angle=0) Rectangle(xy=(4.6, 0), width=0.8, height=0.4171, angle=0) Rectangle(xy=(5.6, 0), width=0.8, height=0.148145, angle=0) Rectangle(xy=(6.6, 0), width=0.8, height=0.78801, angle=0) Rectangle(xy=(7.6, 0), width=0.8, height=0.221423, angle=0) Rectangle(xy=(8.6, 0), width=0.8, height=0.00829394, angle=0) Spine Spine Spine Spine Text(0.5, 0, '') Text(1, 0, '') Line2D() Line2D() Line2D((0,0),(0,1)) Text(0, 0, '') Text(0, 1, '') <matplotlib.axis.XTick object at 0x07BE51D0> Line2D() Line2D() Line2D((0,0),(0,1)) Text(0, 0, '') Text(0, 1, '') <matplotlib.axis.XTick object at 0x07BE51B0> Line2D() Line2D() Line2D((0,0),(0,1)) Text(0, 0, '') Text(0, 1, '') <matplotlib.axis.XTick object at 0x0A589750> Line2D() Line2D() Line2D((0,0),(0,1)) Text(0, 0, '') Text(0, 1, '') <matplotlib.axis.XTick object at 0x0A5A1C50> Line2D() Line2D() Line2D((0,0),(0,1)) Text(0, 0, '') Text(0, 1, '') <matplotlib.axis.XTick object at 0x0A5A1B70> Line2D() Line2D() Line2D((0,0),(0,1)) Text(0, 0, '') Text(0, 1, '') <matplotlib.axis.XTick object at 0x0A5B4170> Line2D() Line2D() Line2D((0,0),(0,1)) Text(0, 0, '') Text(0, 1, '') <matplotlib.axis.XTick object at 0x0A5B4430> XAxis(80.0,52.8) Text(0, 0.5, '') Text(0, 0.5, '') Line2D() Line2D() Line2D((0,0),(1,0)) Text(0, 0, '') Text(1, 0, '') <matplotlib.axis.YTick object at 0x07BE58F0> Line2D() Line2D() Line2D((0,0),(1,0)) Text(0, 0, '') Text(1, 0, '') <matplotlib.axis.YTick object at 0x07BE5570> Line2D() Line2D() Line2D((0,0),(1,0)) Text(0, 0, '') Text(1, 0, '') <matplotlib.axis.YTick object at 0x0A5B4670> Line2D() Line2D() Line2D((0,0),(1,0)) Text(0, 0, '') Text(1, 0, '') <matplotlib.axis.YTick object at 0x0A5B4AB0> Line2D() Line2D() Line2D((0,0),(1,0)) Text(0, 0, '') Text(1, 0, '') <matplotlib.axis.YTick object at 0x0A5B4D90> Line2D() Line2D() Line2D((0,0),(1,0)) Text(0, 0, '') Text(1, 0, '') <matplotlib.axis.YTick object at 0x0A5BE0F0> YAxis(80.0,52.8) Text(0.5, 1.0, '') Text(0.0, 1.0, '') Text(1.0, 1.0, '') Rectangle(xy=(0, 0), width=1, height=1, angle=0) AxesSubplot(0.125,0.11;0.775x0.77)
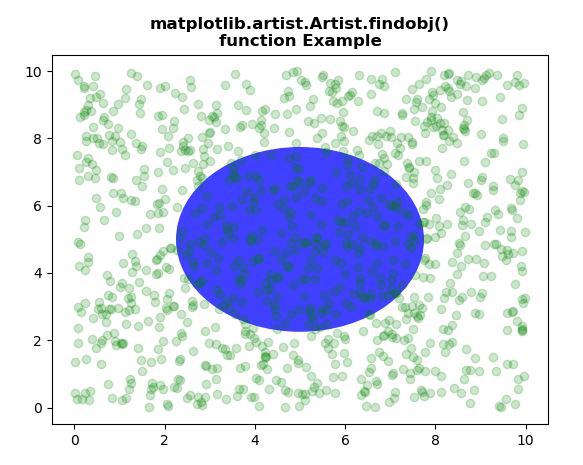
Example 2:
Output:
👁 ImageValue return : Circle(xy=(0.5, 0.5), radius=0.25) Line2D(_line0) Spine Spine Spine Spine Text(0.5, 0, '') Text(1, 0, '') Line2D() Line2D() Line2D((0,0),(0,1)) Text(0, 0, '') Text(0, 1, '') <matplotlib.axis.XTick object at 0x085071F0> Line2D() Line2D() Line2D((0,0),(0,1)) Text(0, 0, '') Text(0, 1, '') <matplotlib.axis.XTick object at 0x085071D0> Line2D() Line2D() Line2D((0,0),(0,1)) Text(0, 0, '') Text(0, 1, '') <matplotlib.axis.XTick object at 0x0AE7ABF0> Line2D() Line2D() Line2D((0,0),(0,1)) Text(0, 0, '') Text(0, 1, '') <matplotlib.axis.XTick object at 0x0AE7AD70> Line2D() Line2D() Line2D((0,0),(0,1)) Text(0, 0, '') Text(0, 1, '') <matplotlib.axis.XTick object at 0x0AE920F0> Line2D() Line2D() Line2D((0,0),(0,1)) Text(0, 0, '') Text(0, 1, '') <matplotlib.axis.XTick object at 0x0AE92390> Line2D() Line2D() Line2D((0,0),(0,1)) Text(0, 0, '') Text(0, 1, '') <matplotlib.axis.XTick object at 0x0AE92650> Line2D() Line2D() Line2D((0,0),(0,1)) Text(0, 0, '') Text(0, 1, '') <matplotlib.axis.XTick object at 0x0AE928F0> XAxis(80.0,52.8) Text(0, 0.5, '') Text(0, 0.5, '') Line2D() Line2D() Line2D((0,0),(1,0)) Text(0, 0, '') Text(1, 0, '') <matplotlib.axis.YTick object at 0x08507910> Line2D() Line2D() Line2D((0,0),(1,0)) Text(0, 0, '') Text(1, 0, '') <matplotlib.axis.YTick object at 0x08507590> Line2D() Line2D() Line2D((0,0),(1,0)) Text(0, 0, '') Text(1, 0, '') <matplotlib.axis.YTick object at 0x0AE92A90> Line2D() Line2D() Line2D((0,0),(1,0)) Text(0, 0, '') Text(1, 0, '') <matplotlib.axis.YTick object at 0x0AE92DB0> Line2D() Line2D() Line2D((0,0),(1,0)) Text(0, 0, '') Text(1, 0, '') <matplotlib.axis.YTick object at 0x0AE92FF0> Line2D() Line2D() Line2D((0,0),(1,0)) Text(0, 0, '') Text(1, 0, '') <matplotlib.axis.YTick object at 0x0AE92B10> Line2D() Line2D() Line2D((0,0),(1,0)) Text(0, 0, '') Text(1, 0, '') <matplotlib.axis.YTick object at 0x0AE7AC50> Line2D() Line2D() Line2D((0,0),(1,0)) Text(0, 0, '') Text(1, 0, '') <matplotlib.axis.YTick object at 0x0AEA00F0> YAxis(80.0,52.8) Text(0.5, 1.0, '') Text(0.0, 1.0, '') Text(1.0, 1.0, '') Rectangle(xy=(0, 0), width=1, height=1, angle=0) AxesSubplot(0.125,0.11;0.775x0.77)