 |
VOOZH | about |
|
VOOZH | about |
Axes.set() function in Matplotlib is used to set multiple Axes properties at once using keyword arguments (**kwargs). This is a convenient way to configure an Axes object with labels, limits, title and more, all in one call. It's key features include:
Example:
Output
Explanation:
Axes.set(self, **kwargs)
Parameters: **kwargs is a keyword arguments representing property names and their values (e.g., xlabel, ylabel, title, xlim, ylim, etc.)
Returns: The modified Axes object.
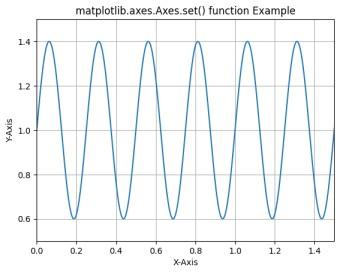
Example 1: In this example, we plot a sine wave and use the ax.set() method to configure multiple properties of the Axes object in one call.
Output
Explanation: This code calculates a sine wave scaled by 0.4 and shifted by 1 to create oscillations around 1, then initializes a figure and axes for plotting. It plots the sine wave against time and uses ax.set() to simultaneously set axis labels, axis limits and the plot title.
Example 2 : In this example, we create a scatter plot with randomly generated data points using NumPy and Matplotlib.
Output
Explanation: This code initializes a figure and axes for plotting, then generates 200 random points for x and y coordinates, along with sizes and colors for each scatter point. It scales the sizes, plots the scatter points and uses ax.set() to set axis labels and limit the displayed range.