 |
VOOZH | about |
|
VOOZH | about |
The Axes.set_aspect() function in axes module of Matplotlib library is used to set the aspect of the axis scaling, i.e. the ratio of y-unit to x-unit. The Axes Class contains most of the figure elements: Axis, Tick, Line2D, Text, Polygon, etc., and sets the coordinate system. The instances of Axes support callbacks through a callbacks attribute.
Syntax: Axes.set_xlabel(self, xlabel, fontdict=None, labelpad=None, **kwargs) Parameters: This method accepts the following parameters.Returns:This method does not returns any value.
- xlabel : This parameter is the label text.
- labelpad : This parameter is the spacing in points from the axes bounding box including ticks and tick labels.
Matplotlib.axes.Axes.set_xlabel() is used to set the label for the x-axis in a plot. It takes a string as an argument, representing the label text. This function allows users to provide a clear description or name for the x-axis, enhancing the overall understanding of the plotted data. The label is then displayed below the x-axis on the plot.
Below are some examples by which we can use Axes Labels Matplotlib in Python:
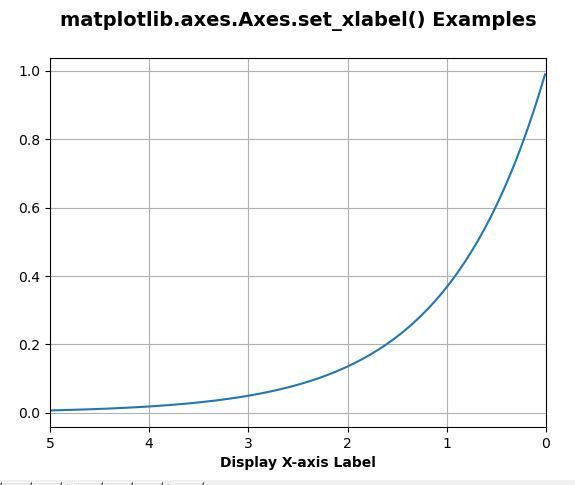
In this example, code utilizes Matplotlib to create a plot of an exponentially decaying function. It defines a time array 't' and corresponding decay values 's'. The script then generates a plot, customizes the X-axis label, sets the plot limits, adds a grid, and provides a bold title.
Output:
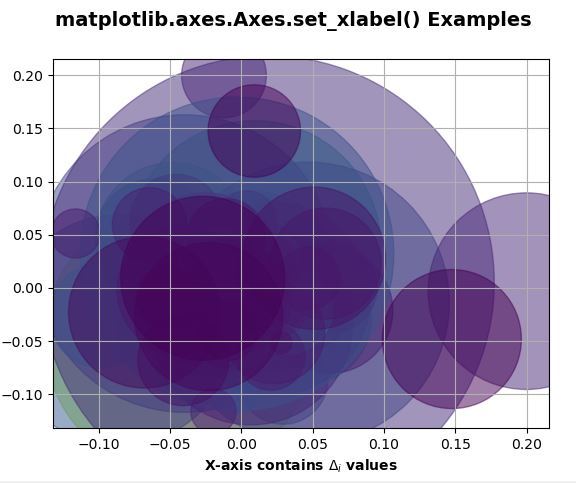
👁 ImageIn this example, code employs Matplotlib to visualize stock data trends. It loads historical stock price data for Google, selects the most recent 250 trading days, calculates price changes and volumes, and then creates a scatter plot. The color and size of the markers indicate close prices and trading volumes, respectively.
Output:
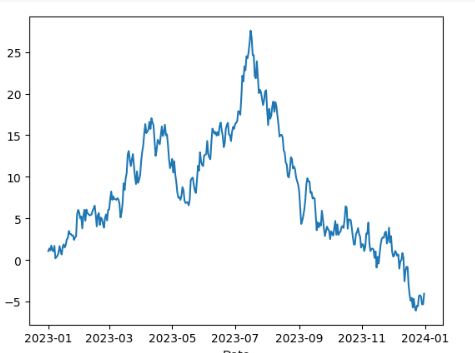
👁 ImageIn this example, the code uses the Matplotlib library to create a time series plot. It generates a sample time series dataset with random values, spanning from January 1, 2023, to December 31, 2023, with a daily frequency. The data is then cumulatively summed and stored in a Pandas DataFrame.
Output: