 |
VOOZH | about |
|
VOOZH | about |
Matplotlib is an amazing visualization library in Python for 2D plots of arrays. Matplotlib is a multi-platform data visualization library built on NumPy arrays and designed to work with the broader SciPy stack.
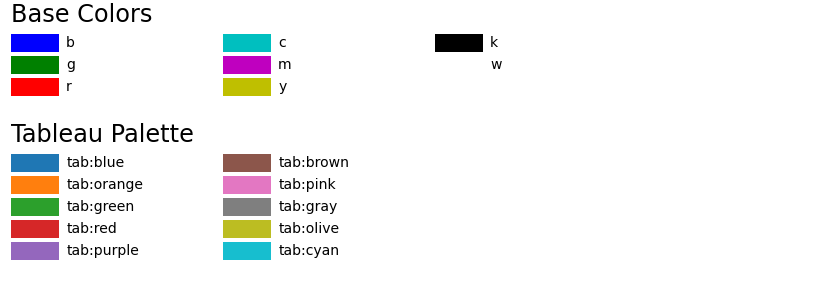
The matplotlib.colors.to_rgba() function is used convert c(color) to an RGBA color. It converts the color name into an array of RGBA encoded colors. It returns an RGBA tuple of four floats from 0-1.
Syntax: matplotlib.colors.to_rgba(c, alpha=None)
Parameters:
- c: It is a matplotlib color or a np.ma.masked color.
- alpha: It is an optional parameter that accepts a scalar. It forces the alpha value if alpha is not None. But if c is "none"(case-sensitive) it maps to (0, 0, 0, 0).
Returns: It returns a tuple of scalars in the form of (r, g, b, a).
Example 1:
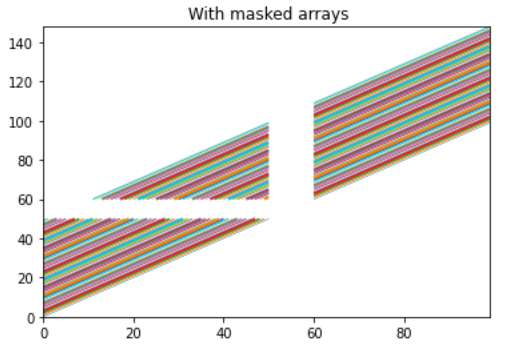
Output:
Example 2: