 |
VOOZH | about |
|
VOOZH | about |
Multiple density plots are a great way of comparing the distribution of multiple groups in your data. We can make multiple density plots using pandas plot.density() function. However, we need to convert data in a wide format if we are using the density function. Wide data represents different groups in different columns. We convert data in a wide format using Pandas pivot() function.
Let's create the simple data-frame and then reshape it into a wide-format:
Example 1:
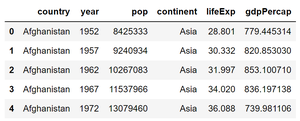
Here we are using this data set.
Step 1: Creating dataframe from data set.
Output:
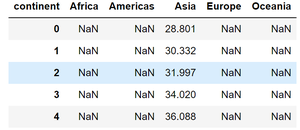
Step 2: Let's group data according to countries in different columns so that we can apply the density() function to plot multiple density plots.
Output:
👁 ImageStep 3: Now let's plot multiple density plot using plot.density()
Output :
Example 2: We can also call plot.kde() function on dataframe to make multiple density plots with Pandas.
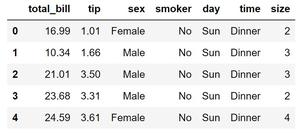
Here we are using the tips dataset for this example, You can find it here.
Step 1: Creating dataframe from data set.
Output:
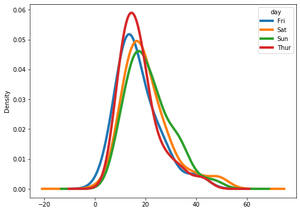
Step 2: Now apply pivot() function to have dataframe in the wide-format then apply kde() to have multiple density plot.
Output: