VOOZH about

URL: https://www.geeksforgeeks.org/python/non-parametric-methods-in-statistics/

⇱ Non - Parametric Methods in Statistics - GeeksforGeeks


  • Courses
  • Tutorials
  • Interview Prep

Non - Parametric Methods in Statistics

Last Updated : 23 Jul, 2025

Non-parametric methods in statistics are techniques that do not assume a specific probability distribution for the data. Unlike parametric methods, which rely on fixed parameters (e.g., mean, variance), non-parametric methods are more flexible and useful when dealing with unknown or complex distributions. These methods are widely applied in hypothesis testing, regression, density estimation and classification.

Common Non-Parametric Statistical Tests

Wilcoxon Rank-Sum Test (Mann-Whitney U Test)

Used to compare two independent groups when normality assumptions do not hold.

where:

  • U is the Mann-Whitney statistic,
  • n1, n2 are the sample sizes,
  • R1 is the sum of ranks for group 1.

Output

Mann-Whitney U test statistic: 10.0 p-value: 0.6857142857142857

Kruskal-Wallis Test

A non-parametric alternative to ANOVA for comparing more than two groups.

where:

  • H is the Kruskal-Wallis statistic,
  • Ri is the rank sum for group i,
  • ni is the sample size of group i,
  • N is the total sample size.

Output

Kruskal-Wallis test statistic: 7.200000000000003 p-value: 0.02732372244729252

Non-Parametric Regression

1. Kernel Density Estimation (KDE)

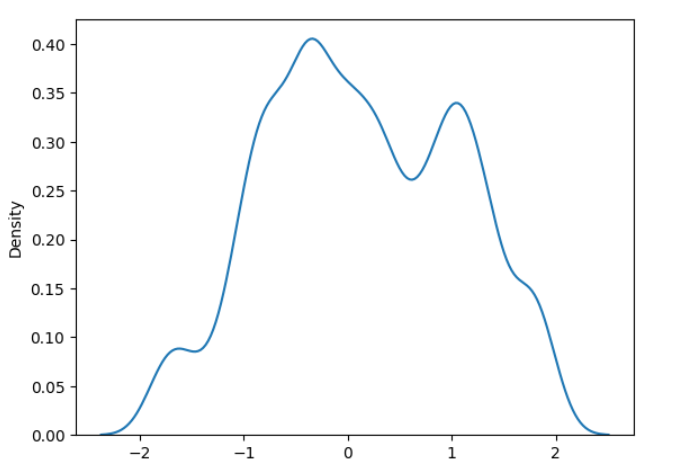
KDE is a technique to estimate the probability density function (PDF) of a dataset.

where:

  • K(.) is the kernel function (e.g., Gaussian kernel),
  • h is the bandwidth parameter,
  • xi are sample points.

Output

👁 Density

2. k-Nearest Neighbors (k-NN) Regression

k-NN is a simple, non-parametric regression method that predicts the target variable based on the mean (or median) of the nearest k neighbors.

where yi are the values of the k nearest neighbors.

Implementation of K-Nearest Neighbors Regression

Output

[7.]

3. Bootstrap Methods

Bootstrap methods are resampling techniques used to estimate the sampling distribution of a statistic.

Algorithm:

  • Randomly sample with replacement from the original dataset.
  • Compute the statistic of interest (e.g., mean, median) on the resampled dataset.
  • Repeat this process many times (e.g., 1000 iterations).
  • Use the empirical distribution of the computed statistic for inference.

Output

Bootstrap Mean Estimate: 6.9883999999999995

Advantages

  • No need for strict assumptions about data distribution.
  • More flexible in handling real-world data.
  • Useful for small datasets where parametric assumptions fail.

Disadvantages

  • Less efficient for large datasets compared to parametric methods.
  • Higher computational cost due to resampling or rank calculations.
  • May require larger sample sizes to achieve reliable results.
Comment
Article Tags:
Article Tags: