 |
VOOZH | about |
|
VOOZH | about |
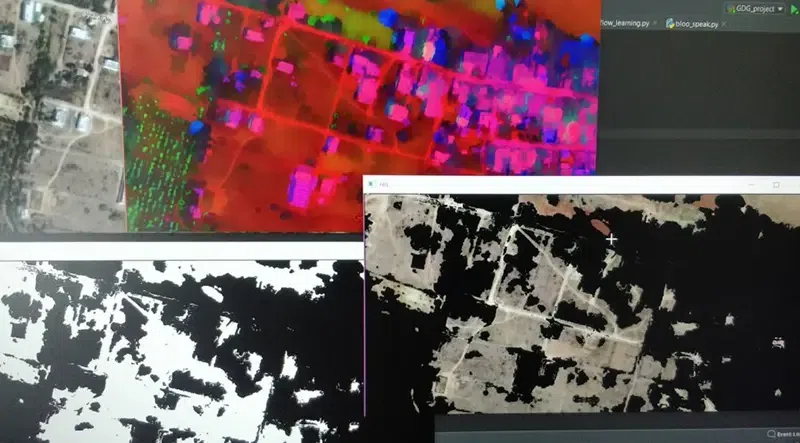
The program aims at controlling the pollution in a given area by suggesting the number of trees and the areas where they should be planted. The heart of the program is Computer Vision. A sample image is given below to get an idea about what we are going to do in this article. Note that we are going to implement this project using the Python language.
In this project, we are using numpy and maths for calculation of our surrounding areas, PIL(Python Imaging Library) for manipulating. Before jumping to the project let’s understand these terms.
Step 1: Create a New Project
Create a new project in PyCharm IDE or V.S. Code
Step 2: Before going to the coding section first you have to do some pre-task
In this project, we need an API key provided by Google Maps.
Step 3: Let's code Map segmentation
The satellite image generated by the 1st step undergoes Image segmentation, which separates all the objects in the image by focussing on edges and boundaries. The image is divided into objects such as buildings, trees, water bodies, roads, barren land, etc. Our first algorithm of choice is Mean Shift Algorithm for segmentation.
Step 4: Let's code for place lookup
The user is required to input the name of the area, on which the program has to be executed. The satellite images of that area will be scraped and are zoomed such as to generate a clear image of the map on which image segmentation can be done.
Step 5: Let's code calculate area
We will be finding the pollution level of the given area. According to that level, we will find the number of trees required to bring that particular level to normal. In this process, we need to train a Classifier that can identify the buildings, the trees, and most importantly, the free land. The Zernike moments used by the above method will be used as features for these segments. The classifier is trained with labels as 'buildings', 'trees', 'water', 'free land', and 'roads'. After the training, we only need to find the part coming under the 'Free Land' label.
Step 6: Let's code main file
Output:
This is how the complete project structure looks like.
👁 ImageGitHub Link:https://github.com/abhishektyagi2912/Pollution-analyses