 |
VOOZH | about |
|
VOOZH | about |
Prerequisite: Altair
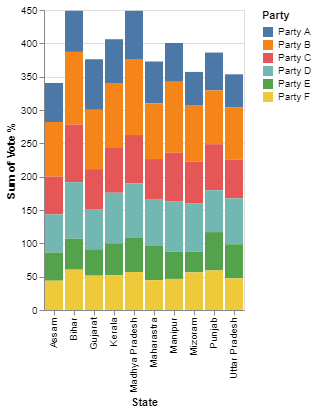
In this article, We will see Stacked Bar Chart With Selection with Altair python. It is a declarative and interactive visualization tool for Python, based on Visualization Grammar (VeGa), It is simple, user-friendly, and moreover provides clearly interpretable charts. It supports a wide variety of charts like bar, line, scatter, box, violin, and other charts in an interactive way. Let's discuss how to create a stacked bar chart with a selection to highlight a particular stack of the bar chart.
The following command can be used to install Altair and Pandas like any other python library:
pip install altair
pip install pandas
pip install altair_viewer
Syntax: altair.selection_single(type, encodings)
- type - string. Determines the default event processing and data query for the selection. Three types single, multi (shift+ click), interval (drag).
- encodings - List of encoding channels. The corresponding data field values must match for a data tuple to fall within the selection.
Syntax: alt.Chart(data).mark_bar().encode(x, y, color)
- x - The x-axis value
- y - The y-axis value
- color - The color of the mark
Import the Altair and pandas package. Read the dataset using pandas and specify the type of selection we have used the selection_single() method. Then, pass the dataset to the chart() function and make use of the mark_bar().encode() method to pass the x and y-axis values and append the selection object after passing the parameters to the mark_bar() function.
Example 1:
The dataset used for demonstration purposes can be downloaded from here.
Output:
To see the interactive visualization, run the code and it will automatically redirect you to an interactive webpage.
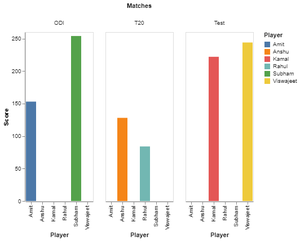
Example 2:
The pandas DataFrame is used for demonstration purposes.
Output: