Matplotlib is an amazing visualization library in Python for 2D plots of arrays. Matplotlib is a multi-platform data visualization library built on NumPy arrays and designed to work with the broader SciPy stack.
Working with Images in Python using Matplotlib
The
image module in
matplotlib library is used for working with images in Python. The
image module also includes two useful methods which are
imread which is used to read images and
imshow which is used to display the image.
Below are some examples which illustrate various operations on images using
matplotlib library:
Example 1: In this example, the program reads an image using the
matplotlib.image.imread() and displays that image using
matplotlib.image.imread().
Output:
👁 Image
Example 2: The below program reads an image and then represents the image in array.
Output:
[[[0.05490196 0.6156863 0.34117648]
 [0.05490196 0.6156863 0.34117648]
 [0.05490196 0.6156863 0.34117648]
 ...
 [0.05490196 0.6156863 0.34117648]
 [0.05490196 0.6156863 0.34117648]
 [0.05490196 0.6156863 0.34117648]]

 [[0.05490196 0.6156863 0.34117648]
 [0.05490196 0.6156863 0.34117648]
 [0.05490196 0.6156863 0.34117648]
 ...
 [0.05490196 0.6156863 0.34117648]
 [0.05490196 0.6156863 0.34117648]
 [0.05490196 0.6156863 0.34117648]]

 [[0.05490196 0.6156863 0.34117648]
 [0.05490196 0.6156863 0.34117648]
 [0.05490196 0.6156863 0.34117648]
 ...
 [0.05490196 0.6156863 0.34117648]
 [0.05490196 0.6156863 0.34117648]
 [0.05490196 0.6156863 0.34117648]]

 ...

 [[0.03529412 0.52156866 0.28235295]
 [0.03529412 0.52156866 0.28235295]
 [0.03529412 0.52156866 0.28235295]
 ...
 [0.05490196 0.6156863 0.34117648]
 [0.05490196 0.6156863 0.34117648]
 [0.05490196 0.6156863 0.34117648]]

 [[0.03529412 0.52156866 0.28235295]
 [0.03529412 0.52156866 0.28235295]
 [0.03529412 0.52156866 0.28235295]
 ...
 [0.05490196 0.6156863 0.34117648]
 [0.05490196 0.6156863 0.34117648]
 [0.05490196 0.6156863 0.34117648]]

 [[0.03529412 0.52156866 0.28235295]
 [0.03529412 0.52156866 0.28235295]
 [0.03529412 0.52156866 0.28235295]
 ...
 [0.05490196 0.6156863 0.34117648]
 [0.05490196 0.6156863 0.34117648]
 [0.05490196 0.6156863 0.34117648]]]
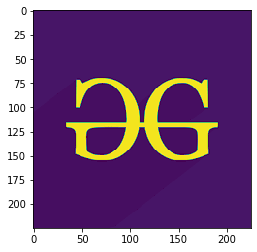
Example 3: Here, the shape of the image is
(225, 225, 3) which represents (height, width, mode) of the image, for colored image mode value is from 0 to 2 and for black and white image mode value is 0 and 1 only. In the output image, only the mode of the image is modified.
Output:
(225, 225, 3)
👁 Image
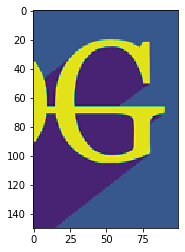
Example 4: In the below program, all the parameters of the shape of the image are modified. Here the height of the image is 150 pixels (displaying from the 50th pixel), width is 100 pixels (displaying from the 100th pixel) and mode value is 1.
Output:
(225, 225, 3)
👁 Image
Example 5: Here, none of the parameters are modified. So, the original image is displayed.
