 |
VOOZH | about |
|
VOOZH | about |
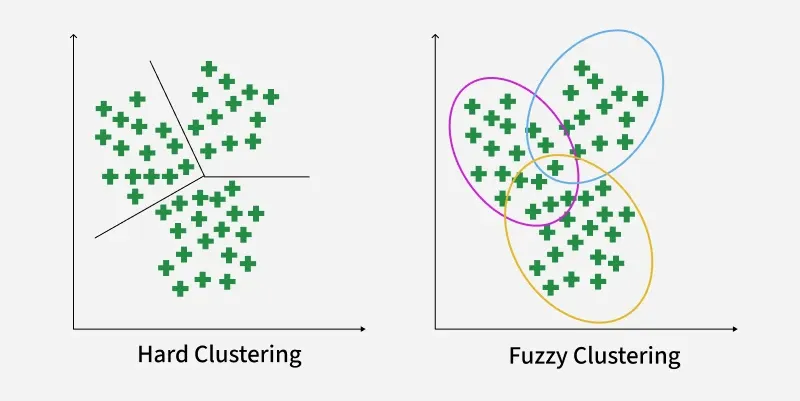
Fuzzy clustering allows each data point to belong to multiple clusters with different membership values. Instead of assigning a point to just one group, it captures how strongly a point relates to each cluster.
Fuzzy clustering assigns each data point a degree of membership for every cluster and updates these values through an iterative process. Here’s how it works:
Step 1: Initialize Membership Values Randomly: Each data point is given random membership scores for all clusters. A point can partially belong to multiple clusters.
For example, for 2 clusters and 4 data points, an initial membership matrix () might look like:
Cluster | (1,3) | (2,5) | (4,8) | (7,9) |
|---|---|---|---|---|
1 | 0.8 | 0.7 | 0.2 | 0.1 |
2 | 0.2 | 0.3 | 0.8 | 0.9 |
Step 2: Compute Cluster Centroids: Centroids are calculated as weighted averages, where weights are membership values raised to the fuzziness parameter m:
Where:
Step 3: Calculate Distance Between Data Points and Centroids: Compute the Euclidean distance between each point and every centroid to determine proximity, which will be used to update memberships. Example for point (1,3):
Similarly the distance of all other points is computed from both the centroids.
Step 4: Update Membership Values: Membership values are updated inversely proportional to these distances. Points closer to a centroid get higher membership.
Updated membership for point k in cluster is:
Step 5: Repeat Until Convergence: Steps 2–4 are repeated until the membership values stabilize meaning there are no significant changes from one iteration to the next. This indicates that the clustering has reached an optimal state.
The scikit-fuzzy (skfuzzy) library provides a pre-defined function for Fuzzy C-Means clustering which can be used in Python.
pip install scikit-fuzzy
We will use numpy for numerical operations, skfuzzy for the Fuzzy C-Means clustering algorithm and matplotlib for plotting the results.
We will creates 100 two-dimensional points clustered using Gaussian noise.
Parameters control clustering behavior: number of clusters, fuzziness degree, stop tolerance and max iterations for convergence.
Converts fuzzy memberships to hard cluster assignments by taking the cluster with highest membership for each point.
This runs the clustering algorithm on the data.
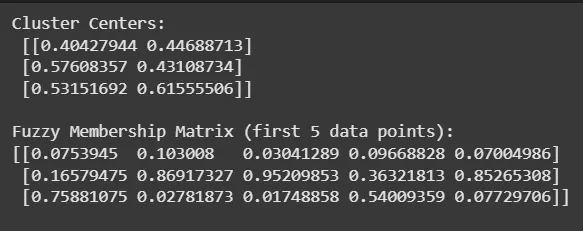
Outputs coordinates of cluster centers and the membership values for the first 5 data points to provide insight into clustering results.
Output:
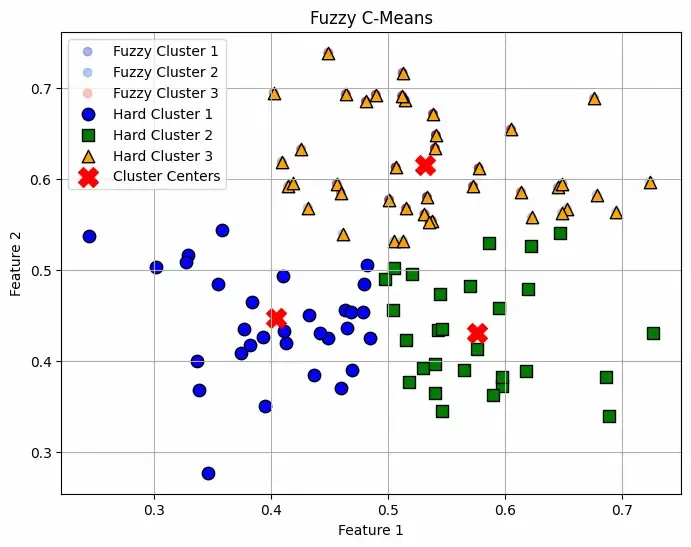
Plots membership levels as soft-colored points and overlays crisp cluster assignments with distinct markers to visualize both fuzzy and hard clustering. Cluster centers are highlighted with red X marks.
Output:
The plot shows soft clustering meaning a point can belong to multiple clusters with different probabilities rather than being assigned to just one cluster. This makes it useful when boundaries between clusters are not well-defined and all the Red "X" markers indicate the cluster centers computed by the algorithm.
You Can Download the complete code from here.