 |
VOOZH | about |
|
VOOZH | about |
Heart disease is one of the main cause of death in world so detecting and predicting it early is important for better treatment and prevention. Machine learning become very helpful in healthcare for predicting conditions like heart disease. One method used is logistic regression which helps to predict the likelihood of something happening like whether a person has heart disease based on input features. In this article we will understand how Logistic regression is used to predict the chances of heart disease in patients.
We will import Numpy, Pandas, Matplotlib, Seaborn, Statsmodels and sklearn library in python.
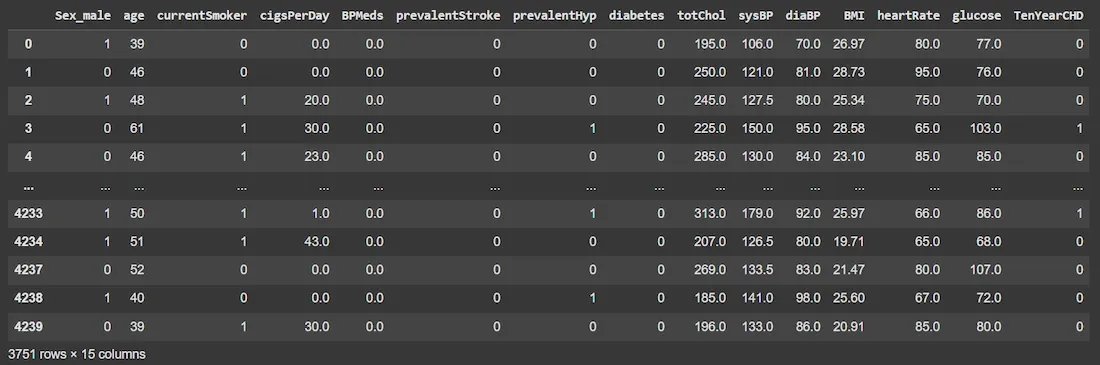
The dataset is from an ongoing cardiovascular study on residents of the town of Framingham, Massachusetts. The classification goal is to predict whether the patient has 10-year risk of future coronary heart disease (CHD). The dataset provides the patients information. It includes over 4,000 records and 15 attributes.
You can download dataset from here.
We will load the dataset and drop the irrelevant features from the the dataset like "education" and rename columns also.
Output:
Output:
We will split the dataset into training and testing portions. But before that we will transform our data by scaling all the features using StandardScaler.
X to have a mean of 0 and standard deviation of 1 using StandardScaler. Scaling is important for many machine learning models, especially when the features have different units or magnitudes.Output:
Train set: (2625, 6) (2625,)
Test set: (1126, 6) (1126,)
In Exploratory Data Analysis (EDA) we perform EDA on the heart disease dataset to understand and gain insights into the dataset before building a predictive model for heart disease.
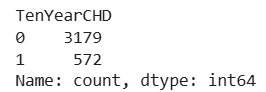
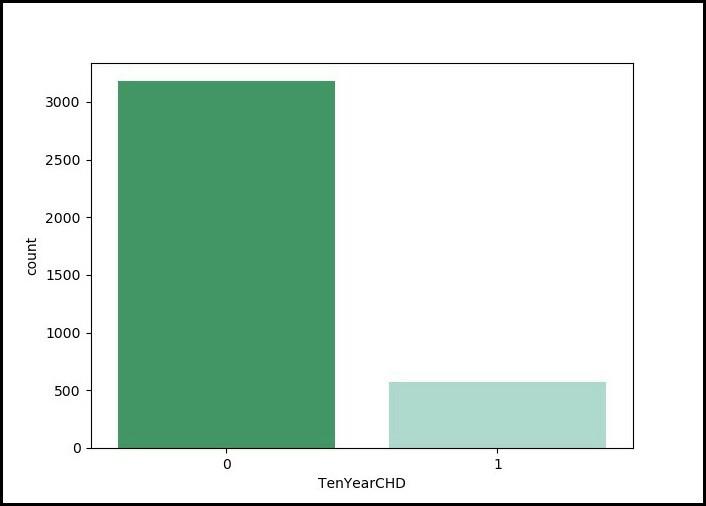
column showing how many individuals have heart disease (1) vs. how many don’t (0).Output:
The count plot shows a high imbalance in the dataset where the majority of individuals (over 3000) do not have heart disease (label 0) while only a small number (around 500) have heart disease (label 1).
Output:
We will create a simple logistic regression model for prediction.
Output:
Accuracy of the model is = 0.8490230905861457
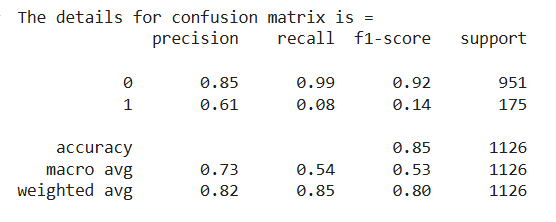
Confusion Matrix is a performance evaluation tool used to assess the accuracy of a classification model. It is used to evaluate the performance of our logistic regression model in predicting heart disease helping us understand how well the model distinguishes between positive and negative cases.
Output:
The model performs well at predicting no heart disease (class 0) but poorly predicts heart disease (class 1) result in an imbalanced classification performance. To enhance model performance techniques such as class balancing, adjust thresholds or experiment with different algorithms help to achieve better results to correctly identify individuals with heart disease.
.png)