 |
VOOZH | about |
|
VOOZH | about |
Analysis of Variance (ANOVA) is a parametric statistical method used to determine whether there is a significant difference among the means of three or more groups by testing the null hypothesis that all group means are equal.
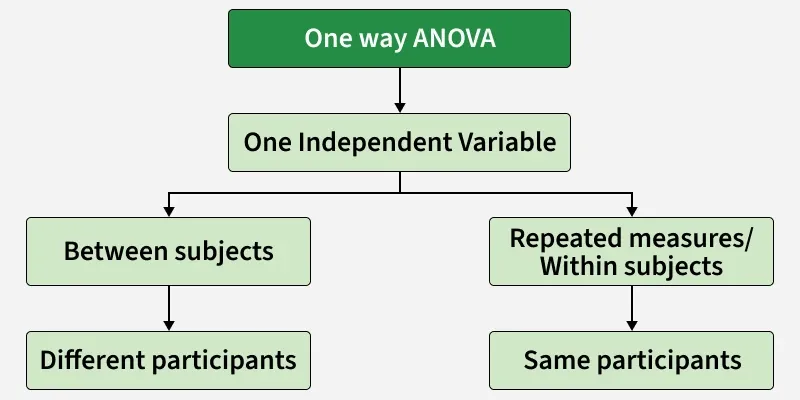
One-way ANOVA is the simplest form of ANOVA used when a single independent variable has three or more groups. It determines whether there are statistically significant differences among the group means by comparing within-group and between-group variation.
A one-way Analysis of Variance (ANOVA) is used when you want to examine the effect of a single categorical independent variable on a quantitative dependent variable. The independent variable must consist of at least three distinct levels or groups.
One-way ANOVA determines whether the mean of the dependent variable differs significantly across the levels of the independent variable. Typical examples include:
The null hypothesis () states that all group means are equal, indicating no effect of the independent variable. The alternative hypothesis () states that at least one group mean differs significantly from the others.
One-way ANOVA is a hypothesis test used to determine whether the means of three or more groups differ significantly based on a single factor. The test statistic used is the F-statistic which compares between-group variance to within-group variance.
This step clarifies what you are testing and what outcome would lead you to reject the null.
Degrees of freedom (df) help determine the critical F-value from statistical tables.
Between groups:
Within groups:
where
The F-statistic is the ratio of variability between groups to variability within groups:
A larger F-value indicates that group means differ more than expected by chance.
Compute the mean of each group. Then calculate the grand mean across all observations:
where
Output:
Group Means: {'Team A': np.float64(48.888888888888886), 'Team B': np.float64(40.0), 'Team C': np.float64(55.111111111111114)}
Overall Mean: 48.0
Measure variability using sum of squares (SS)
Total Sum of Squares:
Within-Group Sum of Squares:
Between-Group Sum of Squares:
This separates variability due to group differences from random error.
Convert sums of squares into mean squares by dividing by their respective degrees of freedom
This is the test statistic used to compare against the critical F-value.
Output:
F-statistic: 208.4164
Output:
Team A p-value: 0.7796
Team B p-value: 0.8299
Team C p-value: 0.4944
Levene's Test p-value: 0.1541
After computing the F-statistic, decide whether to reject or fail to reject
1. Using the F-Table
Compare the calculated F-value () with the critical F-value from the F-distribution table () at the chosen significance level ():
2. Using the p-value
Compare p-value with significance level :
Output:
Reject H0: At least one team mean is significantly different
You can download full code from here