 |
VOOZH | about |
|
VOOZH | about |
Data Wrangling is the process of gathering, collecting, and transforming Raw data into another format for better understanding, decision-making, accessing, and analysis in less time. Data Wrangling is also known as Data Munging.
Data Wrangling is a very important step in a Data science project. The below example will explain its importance:
Books selling Website want to show top-selling books of different domains, according to user preference. For example, if a new user searches for motivational books, then they want to show those motivational books which sell the most or have a high rating, etc.
But on their website, there are plenty of raw data from different users. Here the concept of Data Munging or Data Wrangling is used. As we know Data wrangling is not by the System itself. This process is done by Data Scientists. So, the data Scientist will wrangle data in such a way that they will sort the motivational books that are sold more or have high ratings or user buy this book with these package of Books, etc. On the basis of that, the new user will make a choice. This will explain the importance of Data wrangling.
Data Wrangling is a crucial topic for Data Science and Data Analysis. Pandas Framework of Python is used for Data Wrangling. Pandas is an open-source library in Python specifically developed for Data Analysis and Data Science. It is used for processes like data sorting or filtration, Data grouping, etc.
Data wrangling in Python deals with the below functionalities:
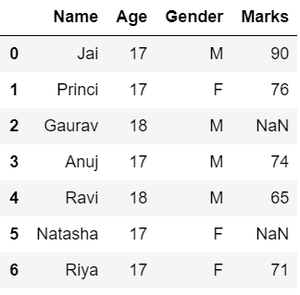
Here in Data exploration, we load the data into a dataframe, and then we visualize the data in a tabular format.
Output:
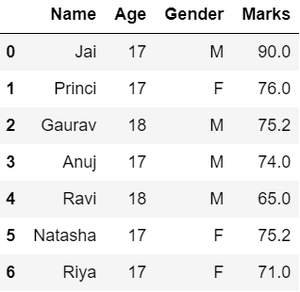
As we can see from the previous output, there are NaN values present in the MARKS column which is a missing value in the dataframe that is going to be taken care of in data wrangling by replacing them with the column mean.
Output:
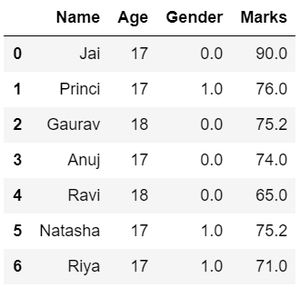
in the GENDER column, we can replace the Gender column data by categorizing them into different numbers.
Output:
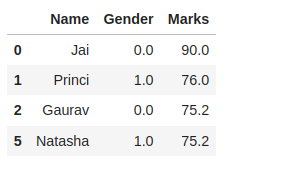
suppose there is a requirement for the details regarding name, gender, and marks of the top-scoring students. Here we need to remove some using the pandas slicing method in data wrangling from unwanted data.
Output:
Hence, we have finally obtained an efficient dataset that can be further used for various purposes.
Now that we have seen the basics of data wrangling using Python and pandas. Below we will discuss various operations using which we can perform data wrangling:
Merge operation is used to merge two raw data into the desired format.
Syntax: pd.merge( data_frame1,data_frame2, on="field ")
Here the field is the name of the column which is similar in both data-frame.
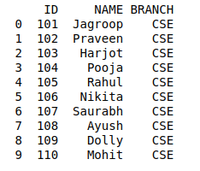
For example: Suppose that a Teacher has two types of Data, the first type of Data consists of Details of Students and the Second type of Data Consist of Pending Fees Status which is taken from the Account Office. So The Teacher will use the merge operation here in order to merge the data and provide it meaning. So that teacher will analyze it easily and it also reduces the time and effort of the Teacher from Manual Merging.
Creating First Dataframe to Perform Merge Operation using Data Wrangling:
Output:
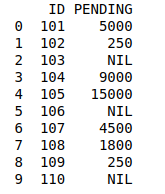
Creating Second Dataframe to Perform Merge operation using Data Wrangling:
Output:
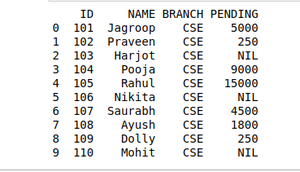
Data Wrangling Using Merge Operation:
Output:
The grouping method in Data wrangling is used to provide results in terms of various groups taken out from Large Data. This method of pandas is used to group the outset of data from the large data set.
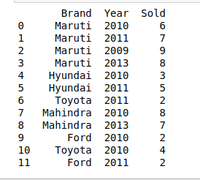
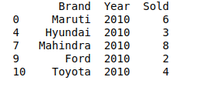
Example: There is a Car Selling company and this company have different Brands of various Car Manufacturing Company like Maruti, Toyota, Mahindra, Ford, etc., and have data on where different cars are sold in different years. So the Company wants to wrangle only that data where cars are sold during the year 2010. For this problem, we use another data Wrangling technique which is a pandasgroupby()method.
Creating dataframe to use Grouping methods[Car selling datasets]:
Output:
Creating Dataframe to use Grouping methods[DATA OF THE YEAR 2010]:
Output:
Pandas duplicates() method helps us to remove duplicate values from Large Data. An important part of Data Wrangling is removing Duplicate values from the large data set.
Syntax: DataFrame.duplicated(subset=None, keep='first')
Here subset is the column value where we want to remove the Duplicate value.
In keeping, we have 3 options :
- if keep ='first' then the first value is marked as the original rest of all values if occur will be removed as it is considered duplicate.
- if keep='last' then the last value is marked as the original rest the above same values will be removed as it is considered duplicate values.
- if keep ='false' all the values which occur more than once will be removed as all are considered duplicate values.
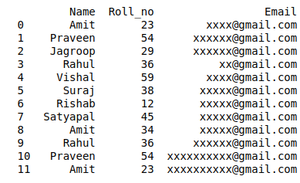
For example, A University will organize the event. In order to participate Students have to fill in their details in the online form so that they will contact them. It may be possible that a student will fill out the form multiple times. It may cause difficulty for the event organizer if a single student will fill in multiple entries. The Data that the organizers will get can be Easily Wrangles by removing duplicate values.
Creating a Student Dataset who want to participate in the event:
Output:
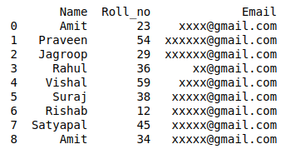
Removing Duplicate data from the Dataset using Data wrangling:
Output:D
We can join two dataframe in several ways. For our example in Concanating Two datasets, we use pd.concat() function.
Creating Two Dataframe For Concatenation.
We will join these two dataframe along axis 0.
output:
 Name Age Address Qualification Mobile No Salary
0 Jai 27 Nagpur Msc 97.0 NaN
1 Princi 24 Kanpur MA 91.0 NaN
2 Gaurav 22 Allahabad MCA 58.0 NaN
3 Anuj 32 Kannuaj Phd 76.0 NaN
4 Gaurav 22 Allahabad MCA NaN 1000.0
5 Anuj 32 Kannuaj Phd NaN 2000.0
6 Dhiraj 12 Allahabad Bcom NaN 3000.0
7 Hitesh 52 Kannuaj B.hons NaN 4000.0
Note:- We can see that data1 does not have a salary column so all four rows of new dataframe res are Nan values.
.webp)