 |
VOOZH | about |
|
VOOZH | about |
Prerequisite: Seaborn
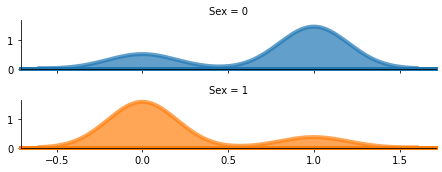
Ridgeline plot is a set of overlapped density plots that help in comparing multiple distributions among datasets. The Ridgeline plots look like a mountain range, they can be quite useful for visualizing changes in distributions over time or space. Sometimes it is also known as "joyplot", in reference to the iconic cover art for Joy Division’s album Unknown Pleasures. In this article, We will see how to generate Ridgeline plots for the dataset.
Like any another python library, seaborn can be easily installed using pip:
pip install seaborn
This library is a part of Anaconda distribution and usually works just by import if your IDE is supported by Anaconda, but it can be installed too by the following command:
conda install seaborn
Syntax: seaborn.FacetGrid(data, row, col, hue, palette, aspect, height)
Parameters:
- data: Tidy (“long-form”) dataframe where each column is a variable and each row is an observation.
- row, col, hue: Variables that define subsets of the data, which will be drawn on separate facets in the grid.
- height: Height (in inches) of each facet.
- aspect: Aspect ratio of each facet, so that aspect * height gives the width of each facet in inches.
- palette: Colors to use for the different levels of the hue variable.
Sample Database: Dataset used in the following example is downloaded from kaggle.com. The following link can be used for the same.
Example:
Output :
👁 Image