 |
VOOZH | about |
|
VOOZH | about |
The pivot() function in PySpark is a powerful method used to reshape a DataFrame by transforming unique values from one column into multiple columns in a new DataFrame, while aggregating data in the process. The function takes a set of unique values from a specified column and turns them into separate columns.
In this article, we will go through a detailed example of how to use the pivot() function in PySpark, covering its usage step by step.
In PySpark, the pivot() function is part of the DataFrame API. It allows us to convert rows into columns by specifying:
The syntax of the pivot() function is:
df.pivot(pivot_column, [values])Where:
Example Data:
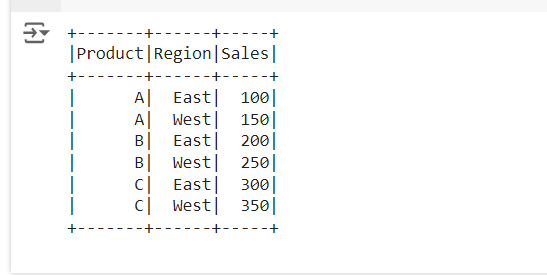
Let's consider the following DataFrame, which contains sales data of different products in various regions:
Product | Region | Sale |
|---|---|---|
A | East | 100 |
A | West | 150 |
B | East | 200 |
B | West | 250 |
C | East | 300 |
C | West | 350 |
We will pivot this data so that each region becomes a column, with sales as the values.
First, let's create a PySpark DataFrame for the sales data
Output:
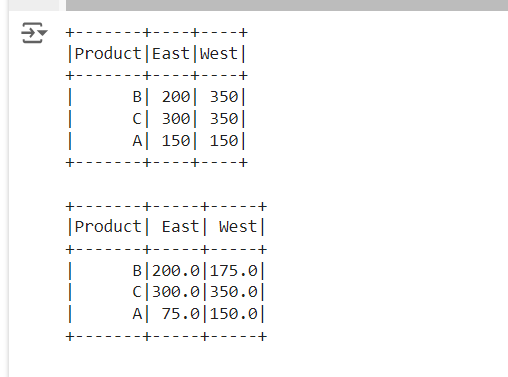
Now we will use the pivot() function to reorganize the data. We want to pivot on the Region column, so that East and West become separate columns. We will aggregate the sales by Product.
Output:
In this output:
We can also apply additional aggregation functions during the pivot process. For example, if we had multiple rows for each Product and Region, we could use avg(), min(), max(), or other aggregate functions.
For example, if we have multiple sales entries for each product in the same region, we can sum them during the pivot.
Output:
Here, for Product A, the sales from two entries in the East region have been summed (100 + 50 = 150). For Product B, the sales in the West region have also been aggregated (250 + 100 = 350).
And for Product A, the sales from two entries in the East region have been averaged ((100 + 50)/2 = 75.0). For Product B, the sales in the West region have also been aggregated ((250 + 100)/2 = 175.0).
The pivot() function in PySpark is a powerful tool for transforming data. It allows us to convert row-based data into column-based data by pivoting on a specific column's values. In this article, we demonstrated how to pivot data using PySpark, with a focus on sales data by region. Additionally, we showed how to apply aggregation methods like sum() during the pivot process. By utilizing pivot(), we can restructure our DataFrame to make it more suitable for further analysis or reporting.
When using pivot(), keep in mind: