 |
VOOZH | about |
|
VOOZH | about |
Seaborn is a Python data visualization library based on matplotlib. It provides a high-level interface for drawing attractive and informative statistical graphics. Seaborn helps resolve the two major problems faced by Matplotlib; the problems are ?
As Seaborn compliments and extends Matplotlib, the learning curve is quite gradual. If you know Matplotlib, you are already half-way through Seaborn.
Draw a plot of two variables with bivariate and univariate graphs. This function provides a convenient interface to the 'JointGrid' class, with several canned plot kinds. This is intended to be a fairly lightweight wrapper; if you need more flexibility, you should use :class:'JointGrid' directly.
Syntax: seaborn.jointplot(x, y, data=None, kind='scatter', stat_func=None, color=None, height=6, ratio=5, space=0.2, dropna=True, xlim=None, ylim=None, joint_kws=None, marginal_kws=None, annot_kws=None, **kwargs)
Parameters: The description of some main parameters are given below:
x, y: These parameters take Data or names of variables in "data".
data: (optional) This parameter take DataFrame when "x" and "y" are variable names.
kind: (optional) This parameter take Kind of plot to draw.
color: (optional) This parameter take Color used for the plot elements.
dropna: (optional) This parameter take boolean value, If True, remove observations that are missing from "x" and "y".
Return: jointgrid object with the plot on it.
Below is the implementation of above method:
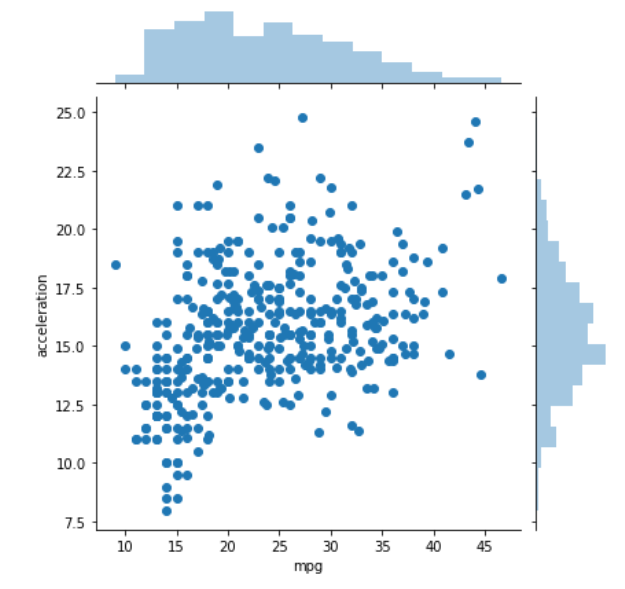
Example 1:
Output:
👁 ImageExample 2:
Output:
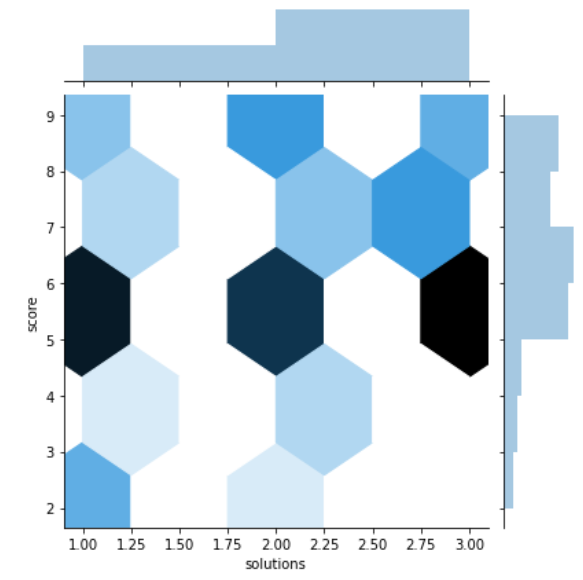
👁 ImageExample 3:
Output:
👁 ImageExample 4: