 |
VOOZH | about |
|
VOOZH | about |
RGB (Red, Green, Blue) color model is widely used in digital image processing, computer graphics and web designing. It represents colors by combining red, green and blue at different intensities to produce a broad spectrum of colors. In this article, we'll take a deeper look at RGB colour model.
We'll start by setting up the necessary libraries like OpenCV, Numpy and Matplotlib. We will load the example image which can be downloaded from here.
By default, any image in opencv is loaded in the Blue-Green-Red (BGR) model.
Output:
We'll then be converting the same image in RGB mode and displaying it.
Output:
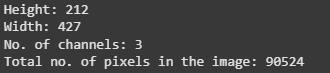
The "shape" attribute returns the height, width and number of channels of an image. Since the RGB Model deals with colour images that have 3 channels.
Output:
Any colour image is basically a 3D matrix. In the RGB colour space the first channel represents the Red component, second and third channels represent the Green and Blue components respectively. Thus a pixel which is the smallest unit of an image is made up of three values: R, G and B.
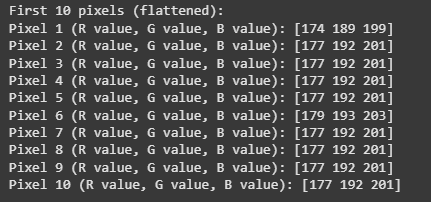
In order to visualize values of pixel we'll be printing the first 10 pixels of this image. For this we need to flatten the 3D matrix into a 1D matrix with 3 columns each where each column represents a channel.
Output:
The cv2 module also has a method to separate the channels. We will use cv2.split() function.
Output:
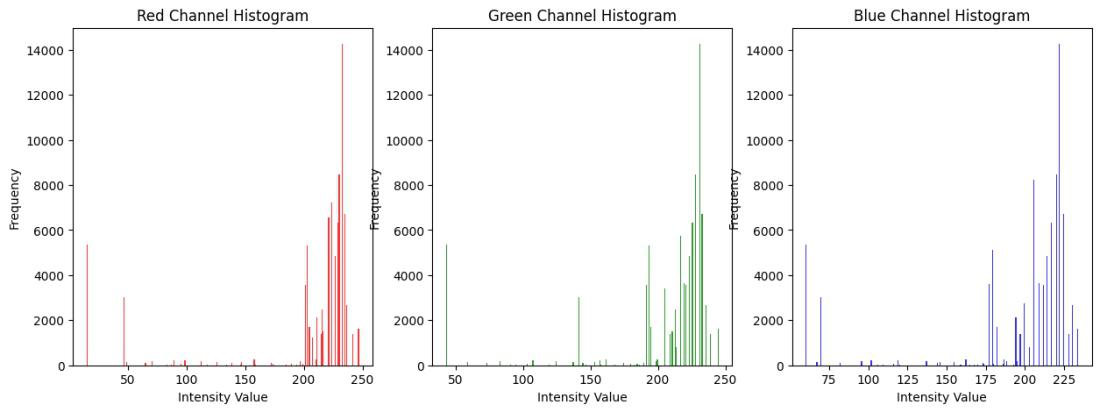
In order to understand the colour distribution of each of the channels of this particular image, we'll look into its histogram.
Output:
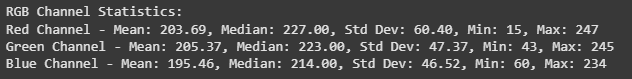
We'll look into the mean, median, standard deviation, minimum and maximum values of each channels.
Output:
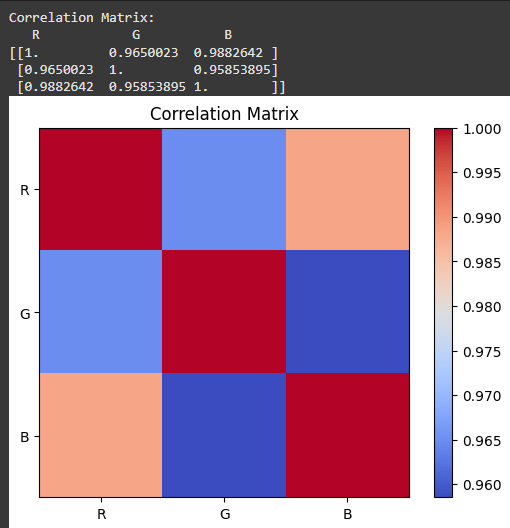
We can obtain the correlation between each of the channels using correlation matrix.
Output:
The color intensity of each cell in the heatmap visually represents correlation values with shades of red indicating higher correlations and blue shades indicating lower correlations. This matrix helps in understanding how the color channels relate to one another in a imagr which is useful in various image processing tasks.