 |
VOOZH | about |
|
VOOZH | about |
Debugging is the process of identifying and correcting bugs in a computer program or software application. The errors or issues that cause the programs to misbehave are known as bugs. These bugs are the expected errors within the program or the application. The term "bug" means "technical error," given by Thomas Edison when describing his little difficulties and faults in his experiments.
Debugging is an integral part of the software development lifecycle, which comes under the software testing phase. The process of debugging starts when there is a bug or issue found in the code and if the problem can be reproduced.
Although there are many IDEs with debug modes in them, Chrome Developer Tools remains the favorite debugger tool for many web developers. Chrome developer tools, also known as dev tools, are a set of the most powerful debugging tools that are integrated into Google Chrome's web browser. It helps developers understand the webpages in depth in real time by allowing them to analyze, inspect, and debug the code step by step.
Dev tools allow developers to edit web pages easily and swiftly, which helps them build better websites in less time.
Chrome dev tools consist of many functionalities and panels that help developers debug.
The following are some of the operations that developers can perform in each panel:
Moreover, Chrome's dev tools code is open source, making it a transparent and custom tool for developers. Google continuously adds new features to its development tools, keeping them up-to-date with evolving web technologies.
To open dev tools, inspect an element in the webpage that opens dev tools elements panel.
On the right side top corner you can change the dockside view. You can see all the files of your webpage in the source panel.
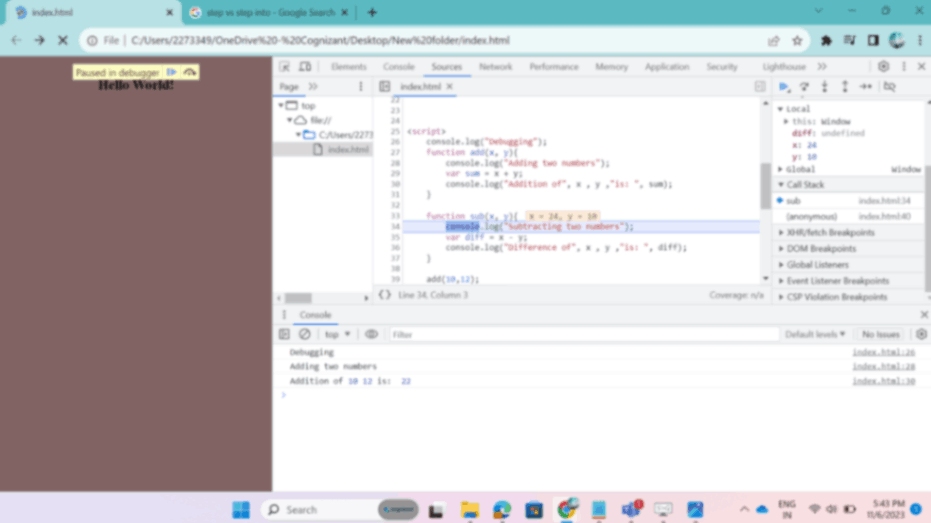
You can set the breakpoints in the JavaScript code where you expect your code has an error. The execution stops or pauses at that point and from there you can manually run the execution of the script with the buttons provided in the top right corner of the panel.
The step over button starts execution from function call and every time you press the step over button it executes the code in the function and moves to the next function call.
The step into button starts execution from the function call and pauses at each line in the function until the function ends.
The step out button continues the execution of the script till the end of last line of the current function.
We can also put breakpoints in our script by using "debugger" at the line where we want to put a breakpoint. To remove all the breakpoints we have a button in the top right corner.
👁 jpeg-optimizer_jpeg-optimizer_SS1
👁 jpeg-optimizer_jpeg-optimizer_SS2
You can watch the call stack for nested functions. Initially the call stack will be empty, when the execution starts the call stack holds the current function inside it when the function is in execution and pops it out once after the execution completes.
👁 jpeg-optimizer_jpeg-optimizer_SS3
Watch the local scope while execution. It holds the values of the variables of the function while the script is in execution.
👁 jpeg-optimizer_jpeg-optimizer_SS4
By using breakpoints and debugger statements we can pause the script for watching the variables and trace the code where the execution is going wrong and then reproduce the error to make the code work as we intend.