 |
VOOZH | about |
|
VOOZH | about |
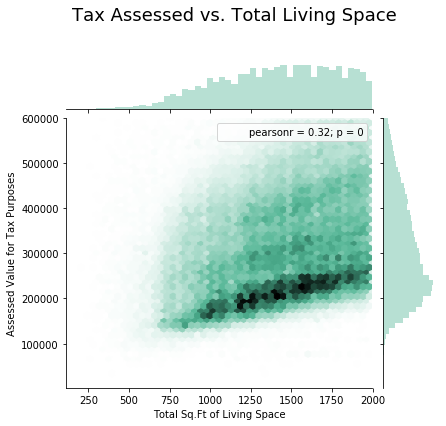
Hexagonal binning is a plot of two numeric variables with the records binned into hexagons. The code below is a hexagon binning plot of the relationship between the finished square feet versus the tax-assessed value for homes. Rather than plotting points, records are grouped into hexagonal bins and color indicating the number of records in that bin.
Loading Libraries
Loading Data
Output:
 TaxAssessedValue SqFtTotLiving ZipCode
0 NaN 1730 98117.0
1 206000.0 1870 98002.0
2 303000.0 1530 98166.0
3 361000.0 2000 98108.0
4 459000.0 3150 98108.0
Data info
Output:
(498249, 3)


RangeIndex: 498249 entries, 0 to 498248
Data columns (total 3 columns):
TaxAssessedValue 497511 non-null float64
SqFtTotLiving 498249 non-null int64
ZipCode 467900 non-null float64
dtypes: float64(2), int64(1)
memory usage: 11.4 MB
Selecting data
Checking for null-value
Output:
False
Code #1: Hexagonal Binning
Output:
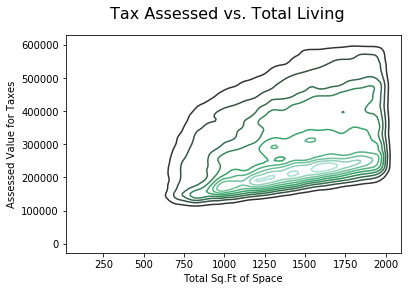
Contour Plot : A contour plot is a curve along which the function of two variable, has a constant value. It is a plane section of the three-dimensional graph of the function f(x, y) parallel to the x, y plane. A contour line joins points of equal elevation (height) above a given level. A contour map is a map is illustrated in the code below. The contour interval of a contour map is the difference in elevation between successive contour lines.
Code #2: Contour Plot
Output: