 |
VOOZH | about |
|
VOOZH | about |
Mayavi is an interactive 3D plotting library that can be used to visualize complex spatial datasets. Although matplotlib can also be used for simple 3D plotting, Mayavi uses a more complex engine (VTK), making Mayavi more suitable for displaying large and complex data. The Mayavi library is like a magic tool that helps us do lots of cool things in a computer program, like creating 3d plots and graphs. We can use it by adding it to our program in Python.
In this article, we will understand and explore the Mayavi library for 3D visualization.
Table of Content
In the Mayavi module, we can easily see and understand scientific data with the help of different tools. But MayaVi is special because it has other cool features that make it stand out from other similar modules. Let's talk about these features now:
We can use pip to install the Mayavi library in our notebook. If you are installing the library in your local system, you can follow these steps:
Install PyQt5:
pip install PyQt5Then, you can install Mayavi by running the following commands in your terminal or command prompt:
pip install mayaviAlternatively, you can install Mayavi from source by downloading the source code from the Mayavi website and then running:
python setup.py installThis will install Mayavi along with its dependencies.
To check if the installation is complete and to run the application call this command in the terminal (MacOS):
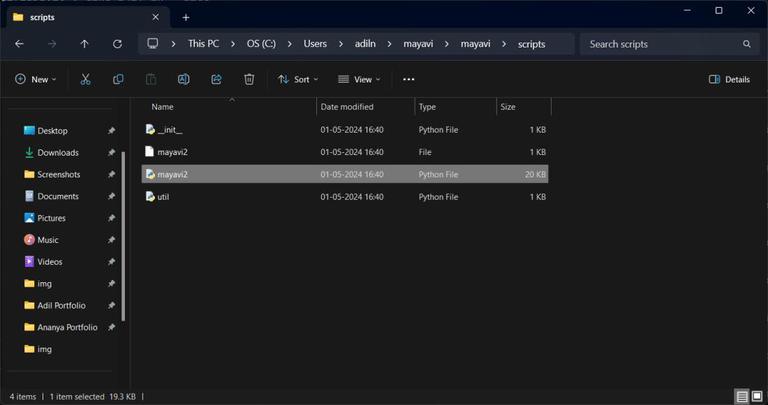
mayavi2For some other platforms like win34 double click mayavi2.exe or mayavi2.py file in the scripts folder which will be inside PythonXY\mayavi folder.
👁 Screenshot-2024-05-01-165917
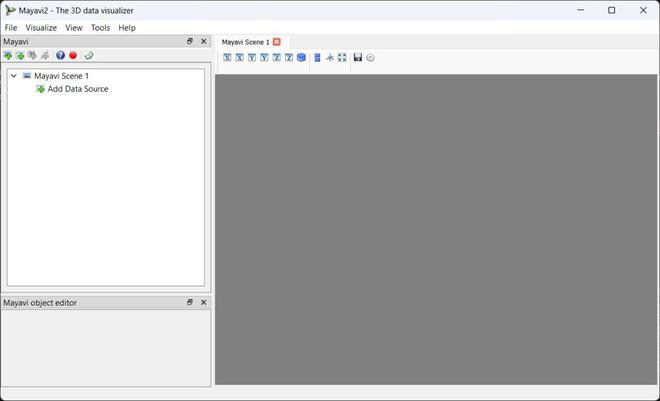
If the installation is completed without any error, this window will open:
👁 Screenshot-2024-05-01-170704
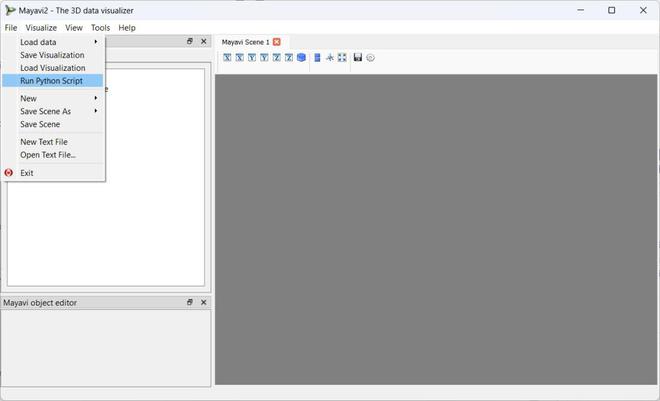
Now let's see how to use the application with few examples. Let's first create a random 3d points using numpy and mlab.points3d() function from mayavi library.
Save this code with .py extension in your system. Now in the mayavi application click on file/Run Python Script, then select the saved python file.
👁 Screenshot-2024-05-01-171316
Once you open the python script you will see the output.
Output:
Now let's plot a 3d line visualization using plot3d() function. We can provide the thickness of the line and the colour we want as parameter to the function. Here's how to do it:
Output:
Save the above code in a new filename.py file and load into the mayavi2 application in the same way as before.
Now let's create a arbitrary regular mesh defined by x, y, z positions of node points. This surface is defined by points connected to form triangles or polygons. We can use mlab.mesh() function to create this plot.
As usual, first we will import the numpy and mayavi libraries.
Output:
An elevation surface is like a bumpy map that shows how high or low things are in a certain area. It helps us see the shape of the land and how steep or flat it is. We use elevation surfaces to study things like mountains, rivers, and other natural features. It helps us see patterns and understand how things are arranged in space.
Output:
Volumetric data refers to a type of data that represents information distributed throughout a three-dimensional space, often within a grid or voxel structure. This data typically represents properties such as density, temperature, pressure, or other scalar or vector quantities within a volumetric region and we can see what's inside by dividing it into lots of little squares and checking what's in each square.
Output:
Mayavi is a really helpful tool that lets people look at and understand complicated data in a 3D way. It's easy to use and has lots of cool features, making it great for scientists and developers. You can do all sorts of things with it, like making basic 3D graphs or more advanced visualizations. It works with Python and can be used on different types of computers, so lots of people can use it to help them study and analyze data in a more visual way.