 |
VOOZH | about |
|
VOOZH | about |
Bokeh is a powerful Python library for creating interactive and visually appealing visualizations for web browsers. While grid lines can help in interpreting the data in a plot, there are scenarios where you might want to remove them for a cleaner, more focused visualization. This article will guide you through the steps to remove grid lines from a Bokeh plot.
Table of Content
Before diving into the removal of grid lines, it's essential to understand how Bokeh handles grids. Bokeh plots include both major and minor grid lines, which are controlled by various properties. These properties allow for extensive customization, including the ability to hide grid lines entirely.
Grid lines are often included in plots to help viewers align data points with the axes. However, in some cases, they can add unnecessary clutter, especially when the data points are dense or when the grid lines do not add significant value to the interpretation of the data.
Removing grid lines can lead to a cleaner and more aesthetically pleasing visualization, allowing the audience to focus on the data itself.
xgrid.grid_line_color and ygrid.grid_line_color: These attributes control the color of the grid lines on the x-axis and y-axis, respectively. Setting them to None effectively hides the grid lines.
First, ensure you have Bokeh installed. If not, you can install it using pip:
Then, import the necessary modules:
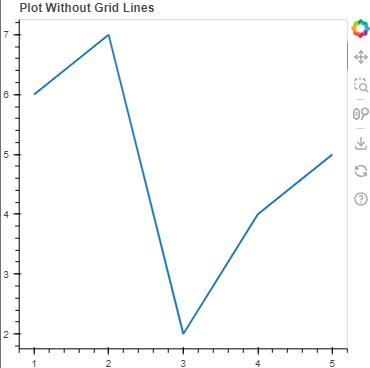
Here’s how you can create a basic plot with grid lines:
Output:
To remove grid lines, you need to set the grid line properties to None. You can do this for both the x-axis and y-axis grids:
Output:
Removing grid lines in Bokeh plots can help create cleaner visualizations and make the plot easier to interpret. Here are two use cases where removing grid lines can enhance the clarity and aesthetic of your Bokeh plots:
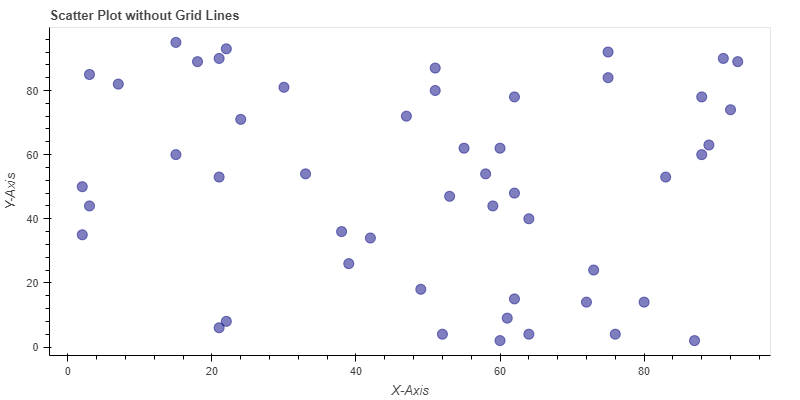
When preparing a scatter plot for a presentation or report, you might want to remove the grid lines to make the data points stand out more clearly. This can help the audience focus on the data itself without the distraction of grid lines.
Output:
For publication in a scientific journal or a minimalist design for a dashboard, you might want to remove grid lines to align with the aesthetic requirements. Removing grid lines can make the bar chart appear cleaner and more professional.
Output:
Removing grid lines in a Bokeh plot is straightforward and can help you create a cleaner and more focused visualization. By setting grid_line_color to None, you can easily remove grid lines, or you can customize their appearance to better suit your needs.