 |
VOOZH | about |
|
VOOZH | about |
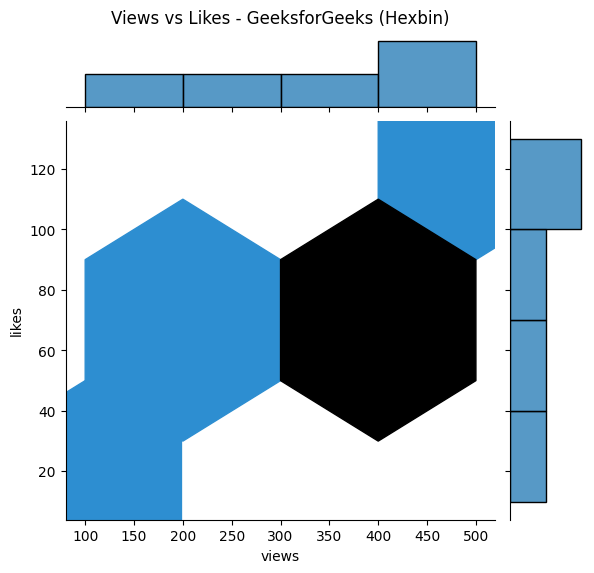
Seaborn Jointplot is a powerful tool for visualizing the relationship between two variables along with their marginal distributions. To set a title on a Seaborn jointplot in Python, you can use the fig.suptitle() method. This method is used to add a title to the figure-level object created by the sns.jointplot() function. In this article, we will explore two different approaches to set titles on the seaborn jointplot in Python.
Below are the possible approaches to set titles on the Seaborn jointplot in Python:
plt.suptitle()ax.set_title()fig.suptitle() after getting the figureIn this approach, we are using plt.suptitle() from matplotlib to set the title of the Seaborn jointplot. This method places the title above the entire figure, allowing for proper alignment and positioning with the y parameter to adjust the vertical placement.
Output:
In this example, we are using ax_joint.set_title() to set the title directly on the main axis of the Seaborn jointplot and the pad parameter to add space between the title and the plot. We also use plt.tight_layout() and plt.subplots_adjust(top=0.9) to adjust the layout and prevent the title from overlapping with the plot elements.
Output:
fig.suptitle()This method involves using the fig.suptitle() method after obtaining the figure object from the jointplot. This approach is useful when you need more control over the figure-level customizations.
Output:
In this article, we explored different methods to set titles on Seaborn jointplots in Python. By using plt.suptitle(), ax.set_title(), and fig.suptitle(), you can enhance the readability and presentation of your data visualizations. These techniques ensure that your visualizations are clear and informative, making them suitable for presentations and reports.
.png)