 |
VOOZH | about |
|
VOOZH | about |
When creating visualizations using Altair, customizing the appearance of your charts is crucial for effective communication of data insights. One of the key aspects of customization is adjusting the font size of various elements, including the chart title. In this article, we will delve into the specifics of how to increase the font size of the chart title in Altair, providing detailed examples and best practices.
Table of Content
Altair provides a robust set of tools for customizing chart titles, but it requires a different approach compared to customizing axis titles or labels. By default, Altair charts do not have a title, but you can easily add one using the title keyword argument.
Altair provides several configuration methods to customize different aspects of a chart. For axis labels and titles, you can use the configure_axis() method, which allows you to set properties like labelFontSize and titleFontSize. However, this method does not affect the chart title itself.
To modify the chart title, you need to use the configure_title() method.
The configure_title() method in Altair allows you to customize the appearance of the chart title, including its font size, font family, and color. Here’s a step-by-step guide on how to use it:
First, ensure you have Altair installed and import it into your Python script. Prepare your data for visualization.
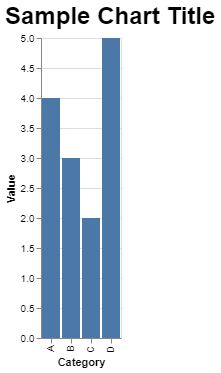
Create a simple chart using Altair. Here, we use a bar chart as an example.
Use the configure_title() method to adjust the font size of the chart title.
Output:
When adjusting font sizes in your Altair charts, consider the following best practices to ensure readability and aesthetic appeal:
While using configure_title(), you might encounter some common issues:
Customizing the font size of the chart title in Altair is a straightforward process once you understand the configuration options available. By using the configure_title() method, you can easily adjust the title's font size and other attributes to enhance the readability and visual appeal of your charts. Following best practices for font size adjustment will ensure that your visualizations are clear, effective, and professional.