Bokeh is a Python interactive data visualization. It renders its plots using HTML and JavaScript. It targets modern web browsers for presentation providing elegant, concise construction of novel graphics with high-performance interactivity.
Bokeh can be used to
plot a line graph. Plotting a line graph can be done using the
line() method of the
plotting module.
plotting.figure.line()
Syntax : line(parameters)
Parameters :
- x : x-coordinates of the points to be plotted
- y : y-coordinates of the points to be plotted
- line_alpha : percentage value of line alpha, default is 1
- line_cap : value of line cap for the line, default is butt
- line_color : color of the line, default is black
- line_dash : value of line dash such as :
- solid
- dashed
- dotted
- dotdash
- dashdot
default is solid
- line_dash_offset : value of line dash offset, default is 0
- line_join : value of line join, default in bevel
- line_width : value of the width of the line, default is 1
- name : user-supplied name for the model
- tags : user-supplied values for this model
Other Parameters :
- alpha : sets all alpha keyword arguments at once
- color : sets all color keyword arguments at once
- legend_field : name of a column in the data source that should be used
- legend_group : name of a column in the data source that should be used
- legend_label : labels the legend entry
- muted : determines whether the glyph should be rendered as muted or not, default is False
- name : optional user-supplied name to attach to the renderer
- source : user-supplied data source
- view : view for filtering the data source
- visible : determines whether the glyph should be rendered or not, default is True
- x_range_name : name of an extra range to use for mapping x-coordinates
- y_range_name : name of an extra range to use for mapping y-coordinates
- level : specifies the render level order for this glyph
Returns : an object of class GlyphRenderer
Example 1 :In this example we will be using the default values for plotting the graph.
Output :
👁 Image
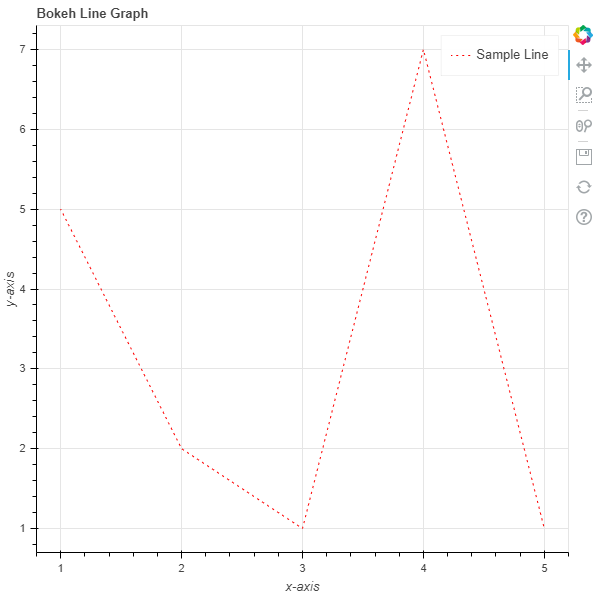
Example 2 :In this example we will be plotting a line graph with dotted lines alongside other parameters.
Output :
👁 Image
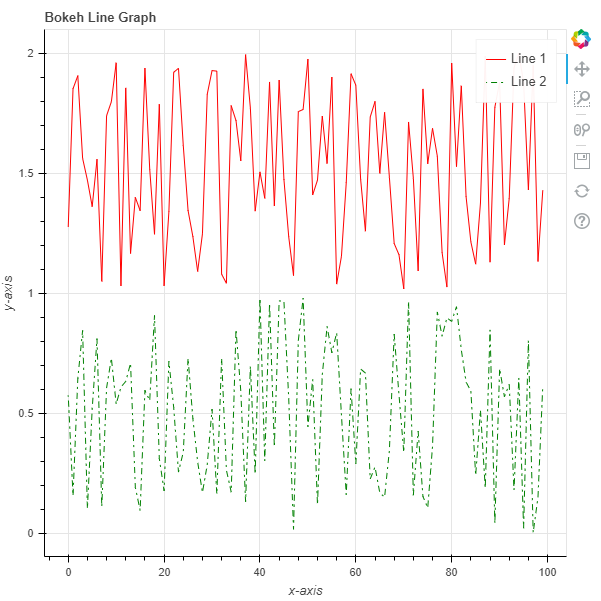
Example 3 :Now we will see how to plot multiple lines in the same graph. We will generate the points using the
random() function.
Output :
👁 Image