Bokeh is a Python interactive data visualization. It renders its plots using HTML and JavaScript. It targets modern web browsers for presentation providing elegant, concise construction of novel graphics with high-performance interactivity.
Bokeh can be used to plot quadratic curves on a graph. Plotting quadratic curves on a graph can be done using the
quadratic() method of the
plotting module.
plotting.figure.quadratic()
Syntax : quadratic(parameters)
Parameters :
- x0 : x-coordinates of the starting points of the quadratic
- y0 : y-coordinates of the starting points of the quadratic
- x1 : x-coordinates of the ending points of the quadratic
- y1 : y-coordinates of the ending points of the quadratic
- cx : x-coordinates of the control points of the quadratic
- cy : y-coordinates of the control points of the quadratic
Returns : an object of class GlyphRenderer
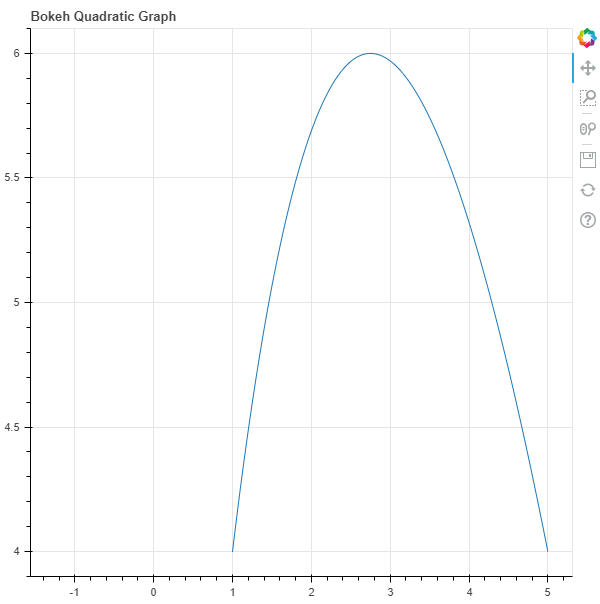
Example 1 : In this example we will be using the default values for plotting the graph.
Output :
👁 Image
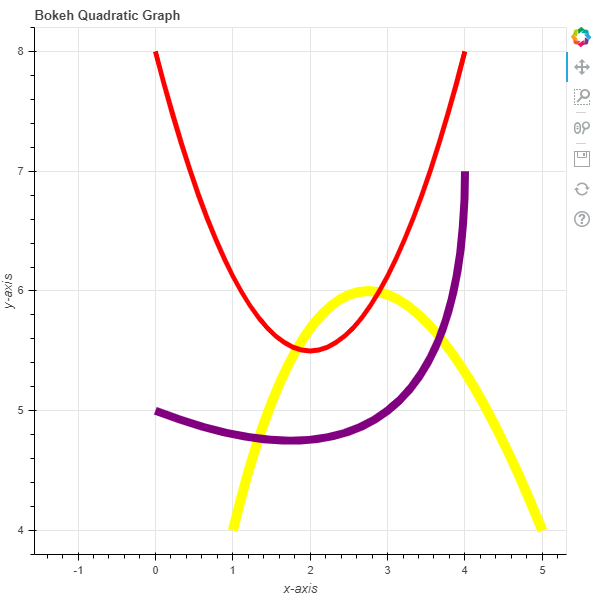
Example 2 : In this example we will be plotting multiple quadratic curves with various other parameters.
Output :
👁 Image