 |
VOOZH | about |
|
VOOZH | about |
Seaborn is a Python data visualization library based on matplotlib. It provides a high-level interface for drawing attractive and informative statistical graphics. Seaborn helps resolve the two major problems faced by Matplotlib; the problems are ?
As Seaborn compliments and extends Matplotlib, the learning curve is quite gradual. If you know Matplotlib, you are already half way through Seaborn.
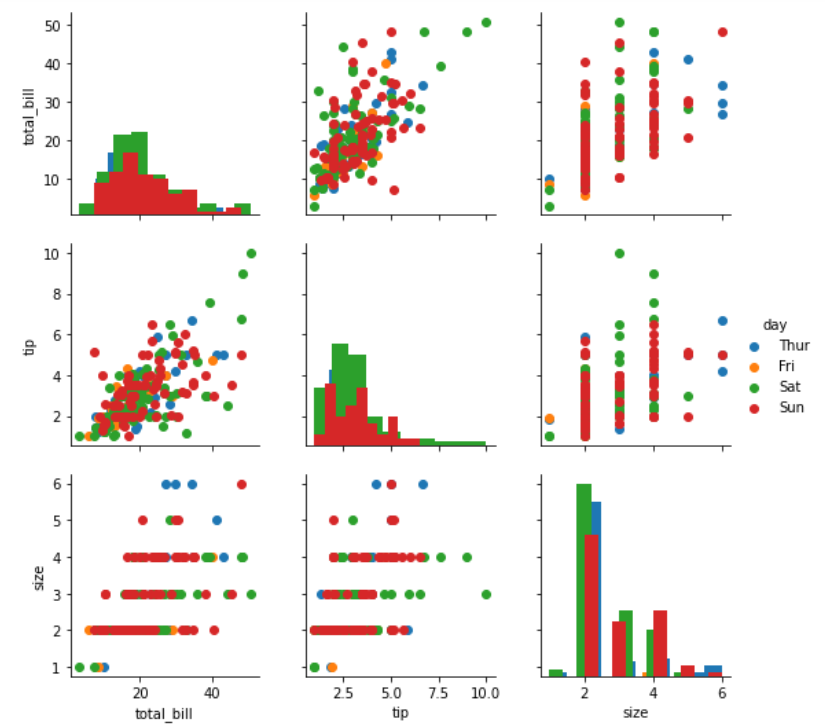
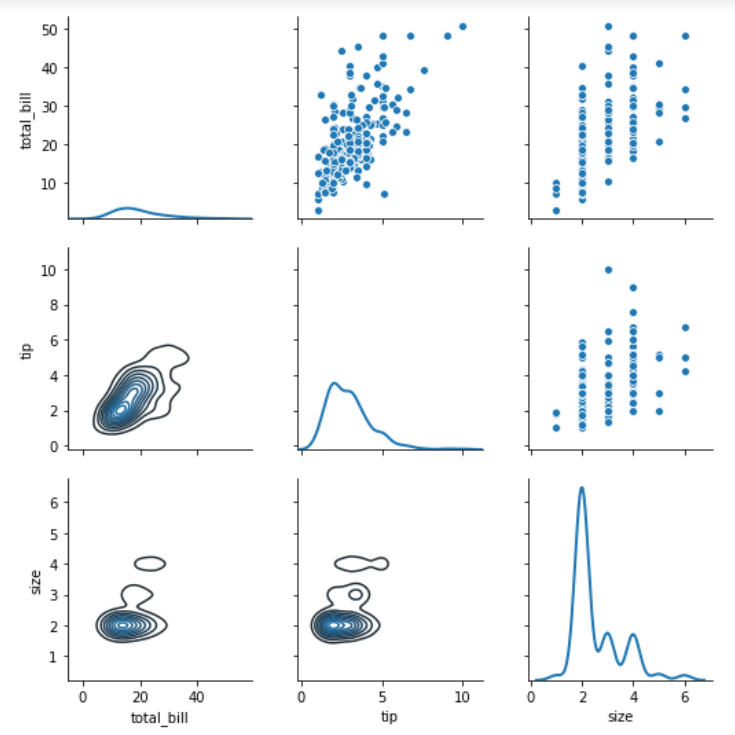
seaborn.PairGrid( data, \*\*kwargs)
Seaborn.PairGrid uses many arguments as input, main of which are described below in form of table:
| Arguments | Description | Value |
| data | Tidy (long-form) dataframe where each column is a variable and each row is an observation. | DataFrame |
| hue | Variable in ``data`` to map plot aspects to different colors. | string (variable name), optional |
| palette | Set of colors for mapping the ``hue`` variable. If a dict, keys should be values in the ``hue`` variable. | dict or seaborn color palette |
| vars | Variables within ``data`` to use, otherwise use every column with a numeric datatype. | list of variable names, optional |
| dropna | Drop missing values from the data before plotting. | boolean, optional |
Below is the implementation of above method:
Example 1: