 |
VOOZH | about |
|
VOOZH | about |
Categorical data refers to features that contain a fixed set of possible values or categories that data points can belong to. Handling categorical data correctly is important because improper handling can lead to inaccurate analysis and poor model performance. In this article, we will see how to handle categorical data and its related concepts.
Handling categorical data is important because:
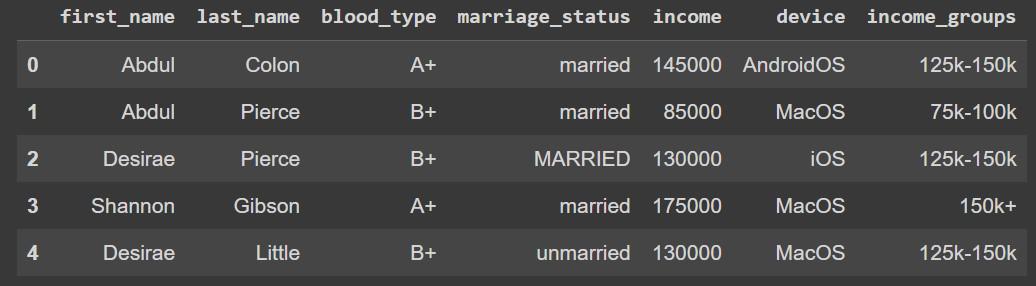
Here we will be using a Demographics dataset which has some incorrect, invalid or meaningless data (bogus values) due to human error while filling survey form or any other reason. You can download dataset from here.
We will be using Numpy, Pandas, Matplotlib, Seaborn and Scikit-learn libraries for its implementation.
We load the dataset into a Pandas DataFrame for manipulation.
Output:
First we create a DataFrame containing all valid blood types to check for bogus values in the dataset:
Output:
👁 Handling Categorical Data in PythonLets find bogus bloodtypes by comparing the dataset values to this valid list:
Output:
{'C+', 'D-'}
Once the bogus values are found the corresponding rows can be dropped from the dataset.
Output:
array(['A+', 'B+', 'A-', 'AB-', 'AB+', 'B-', 'O-', 'O+'], dtype=object)
Checking the unique values in the marriage_status column:
Output:
array(['married', 'MARRIED', ' married', 'unmarried ', 'divorced', 'unmarried', 'UNMARRIED', 'separated'], dtype=object)
Standardizing the categories by converting all text to lowercase.
Output:
array(['married', ' married', 'unmarried ', 'divorced', 'unmarried', 'separated'], dtype=object)
Now we will standardize the categories by stripping extra spaces:
Output:
array(['married', 'unmarried', 'divorced', 'separated'], dtype=object)
Numerical data like age or income can be mapped to different groups. Let us check income range to define bin intervals:
Output:
Max income - 190000, Min income - 40000
Now, let us create the range and labels for the income feature. Pandas cut method is used here.
Output:
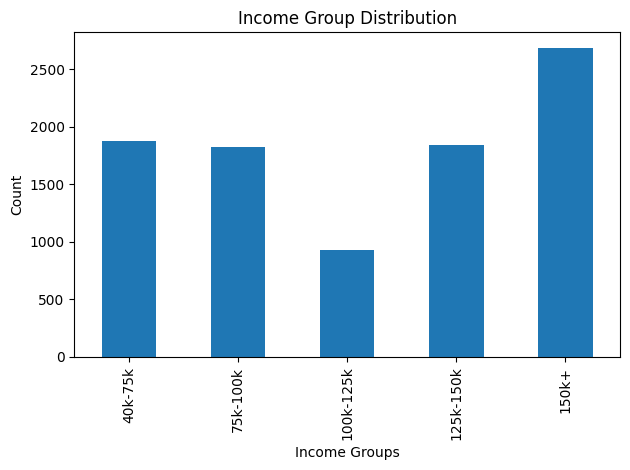
Now lets visualize the distribution of income groups:
Output:
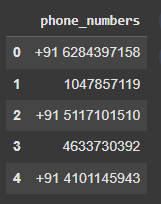
Simulating phone numbers with inconsistent formats and cleaning them:
Output:
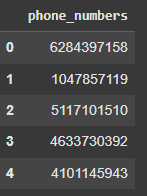
Based on the use case the country code before numbers could be dropped or added for missing ones. Similarly phone numbers with less than 10 numbers should be discarded.
Output:
Finally we can verify whether the data is clean or not.
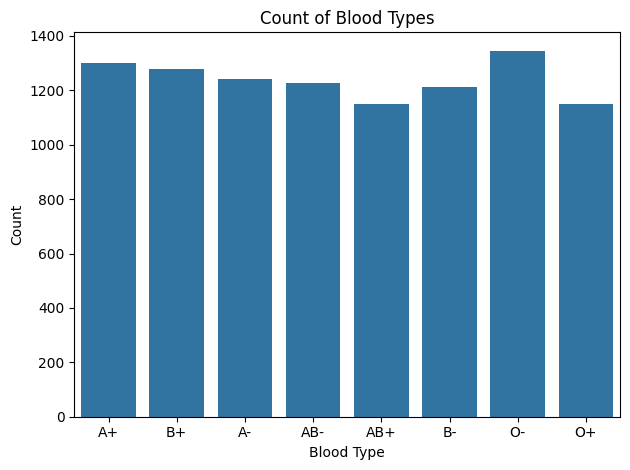
Various plots could be used to visualize categorical data to get more insights about the data. So let us visualize the number of people belonging to each blood type.
Output:
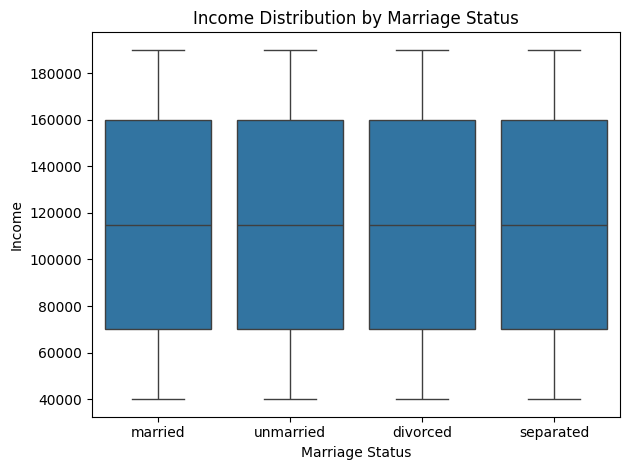
Now we can see the relationship between income and the marital status of a person using a boxplot.
Output:
Certain learning algorithms like regression and neural networks require their input to be numbers. Hence categorical data must be converted to numbers to use these algorithms. Let us see some encoding methods.
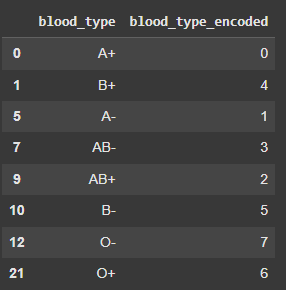
1. Label Encoding
With label encoding we can number the categories from 0 to num_categories - 1. Let us apply label encoding on the blood type feature.
Output:
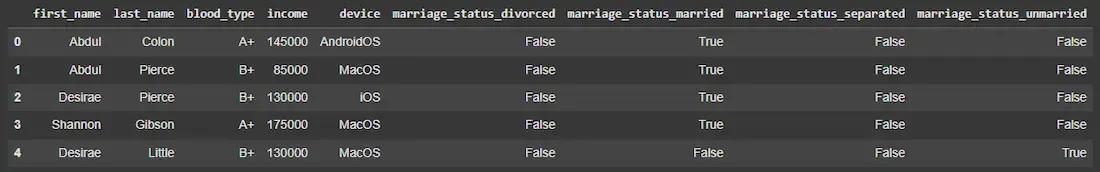
2. One-hot Encoding in Python
There are certain limitations of label encoding that are taken care of by one-hot encoding. Some of them are:
Output:
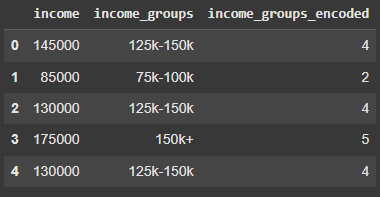
3. Ordinal Encoding in Python
Categorical data can be ordinal where the order is of importance. For such features, we want to preserve the order after encoding as well. We will perform ordinal encoding on income groups. We want to preserve the order as 40K-75K < 75K-100K < 100K-125K < 125K-150K < 150K+
Output:
With these techniques we can prepare categorical data for meaningful analysis and effective machine learning models.