 |
VOOZH | about |
|
VOOZH | about |
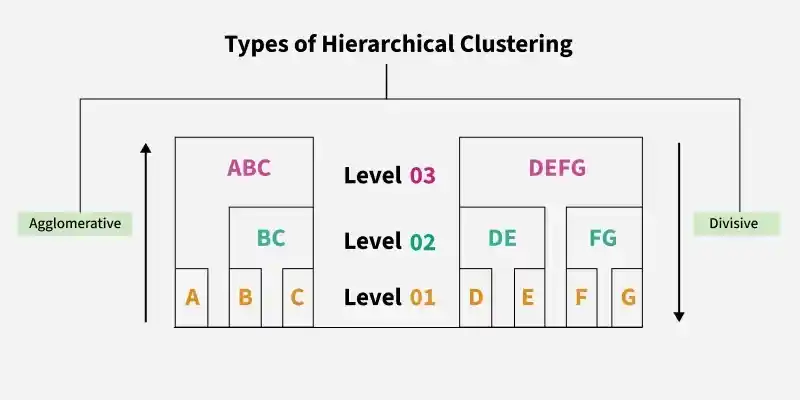
Hierarchical Clustering is an unsupervised learning technique that groups data into a hierarchy of clusters based on similarity. It builds a tree-like structure called a dendrogram, which helps visualise relationships and decide the optimal number of clusters.
Scikit Learn provides a straightforward implementation of Agglomerative hierarchical clustering through the Agglomerative Clustering class.
Here we will import numpy, pandas, matplotlib and scikit learn for its implementation.
Feature scaling matters in Hierarchical Clustering because the algorithm relies on distance calculations and is highly sensitive to feature magnitudes.
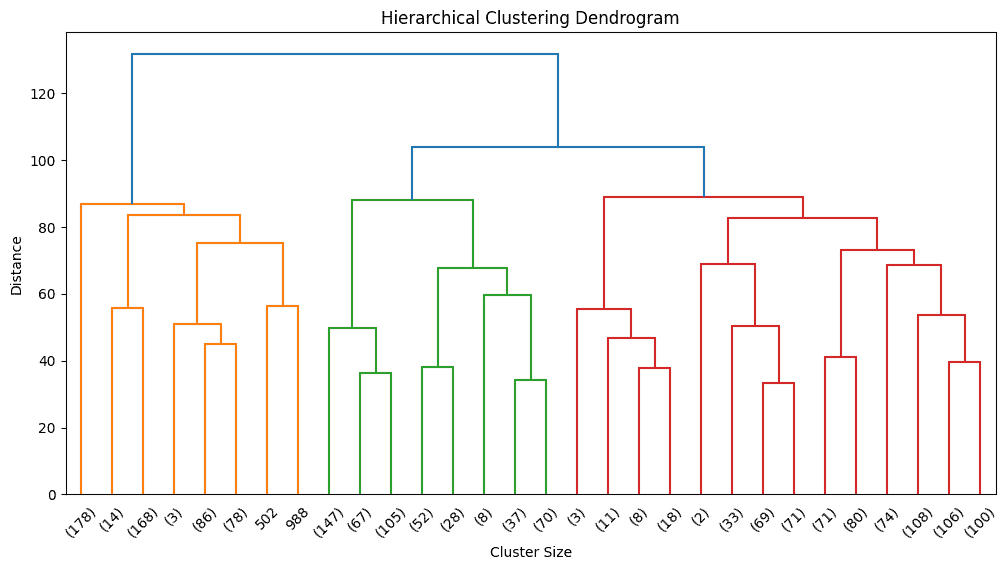
Before selecting the number of clusters, we visualize the hierarchy using a dendrogram.
Output:
Based on dendrogram inspection, we choose a reasonable number of clusters.
This step fits the hierarchical clustering model to the scaled data and assigns a cluster label to each data point. Each label represents the cluster formed from the hierarchical structure defined by the dendrogram.
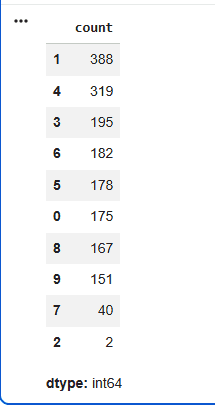
This step shows how data points are distributed across clusters. It provides quick insight into cluster balance, helps detect over fragmentation and highlights dominant groupings, making it an important checkpoint before using the clusters downstream.
Output:
Output:
Score : 0.13
Scikit Learn does not provide a dedicated library or built in API for divisive clustering. Instead, the approach is implemented manually by applying a top down recursive splitting strategy, most commonly using K Means clustering from scikit learn to divide clusters step by step.
Here we will import numpy and scikit learn library.
Feature scaling ensures stable and meaningful partitioning.
This function applies a top down divisive clustering strategy, where the dataset is repeatedly split into smaller clusters to reveal finer patterns.
This step applies divisive clustering to the scaled data using the defined depth and minimum size.
This step calculates the number of data points in each final cluster to understand how the data has been split.
Output:
[39, 568, 643, 369, 178]
This step transforms the hierarchical, tree based clustering output into flat cluster labels, which are required by most machine learning pipelines to enable evaluation, visualization and deployment.
Output:
Score : -0.04
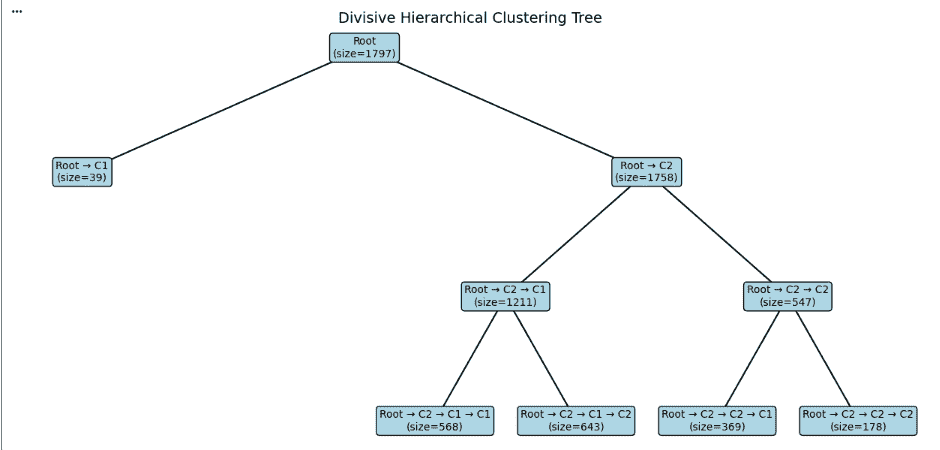
Now we will visualize the divisive clustering process as a tree.
Now, Assigns X and Y positions to each node, where depth controls the vertical placement and child nodes are distributed horizontally to maintain proper spacing.
Now we extract the parent child relationships by recursively traversing the tree. For each node, we store its connection to its children so that these relationships can later be drawn as lines in the visualization. This step builds the structural backbone required to clearly represent the hierarchical clustering tree.
Now we draw the tree by connecting each parent node to its children and displaying the cluster size inside every node. Colours are used to make the structure easier to read. This creates a clear top down view of how the data was split during divisive clustering.
Output:
You can download the code from here