 |
VOOZH | about |
|
VOOZH | about |
NCERT Solutions Class 10 Maths Chapter 14 Statistics - This article is a useful resource containing free NCERT Solutions for Class 10 Maths Chapter 14 Statistics. These NCERT solutions have been developed by the subject matter experts at GFG to assist students in easily solving questions related to Statistics from the NCERT textbook.
These NCERT Solutions for Class 10 Maths Chapter 14 Statistics cover all four exercises of the NCERT Class 10 Maths Chapter 14 according to the latest CBSE syllabus 2023-24 and guidelines, which are as follows:
Class 10 Maths NCERT Solutions Chapter 14 Statistics Exercises |
|---|
|
|
|
|
NCERT Class 10 Maths Chapter 14 Statistics will help the students learn important statistical concepts like mean, mode, standard deviation, and the graphical depiction of cumulative frequency distribution.
The solutions to all the problems in this Chapter 14 Statistics exercises from the NCERT textbook have been properly covered in the NCERT Solutions for Class 10 Maths.
Number of Plants | 0-2 | 2-4 | 4-6 | 6-8 | 8-10 | 10-12 | 12-14 |
Number of houses | 1 | 2 | 1 | 5 | 6 | 2 | 3 |
Solution:
Step 1: Let us find out the Class Mark (xi) for the following class intervals by using the formula
Class Mark = (Upper class Limit + Lower Class Limit)/2
Step 2: Now, we will multiply the classmark with the number of times they have occurred, i.e, with the frequency.
Step 3: Now we will apply the general formula to calculate the mean
Now, Let's see the detailed solution:
No.of Plants (Class Interval) | No. of Houses (Frequency) (fi) | Class Mark (xi) | fi * xi |
|---|---|---|---|
0-2 | 1 | 1 | 1 |
2-4 | 2 | 3 | 6 |
4-6 | 1 | 5 | 5 |
6-8 | 5 | 7 | 35 |
8-10 | 6 | 9 | 54 |
10-12 | 2 | 11 | 22 |
12-14 | 3 | 13 | 39 |
Sum: ∑ fi = 20 | Sum: ∑ fixi = 162 |
Now, after creating this table we will be able to find the mean very easily -
= 16
= 8.1
Hence, we come to the conclusion that the number of plants per house is 8.1. Since the numeral value of frequency(fi) and the class mark(xi) is small so we use DIRECT METHOD to find the mean number of plants per house.
Daily Wages (in ₹) | 500-520 | 520-540 | 540-560 | 560-580 | 580-600 |
Number of Workers | 12 | 14 | 8 | 6 | 10 |
Solution:
Step 1: Let us find out the Class Mark (xi) for the following class intervals by using the formula
Class Mark = (Upper class Limit + Lower Class Limit)/2
Step 2: In this case, the value of mid-point (xi) is very large, so let us assume the mean value, A = 150, and the class interval is h = 20.
ui = (xi – A)/h
=> ui = (xi – 150)/20
Step 3: Now we will apply the Assumed Mean Formula to calculate the mean
Now, Let's see the detailed solution:
Daily wages (Class interval) | Number of workers frequency (fi) | Mid-point (xi) | ui = (xi – 150)/20 | fiui |
|---|---|---|---|---|
100-120 | 12 | 110 | -2 | -24 |
120-140 | 14 | 130 | -1 | -14 |
140-160 | 8 | 150 | 0 | 0 |
160-180 | 6 | 170 | 1 | 6 |
180-200 | 10 | 190 | 2 | 20 |
Total | Sum ∑fi = 50 | Sum ∑fiui = -12 |
So, the formula to find out the mean is:
Mean =
= 150 + (20 × -12/50)
= 150 – 4.8
= 145.20
Thus, mean daily wage of the workers = Rs. 145.20.
Daily pocket allowance (in ₹) | 11-13 | 13-15 | 15-17 | 17-19 | 19-21 | 21-23 | 23-25 |
Number of children | 7 | 6 | 9 | 13 | f | 5 | 4 |
Solution:
Step 1: Let us find out the Class Mark (xi) for the following class intervals by using the formula
Class Mark = (Upper class Limit + Lower Class Limit)/2
Step 2: Now, we will multiply the classmark with the number of times they have occurred, i.e, with the frequency. As a certain frequency is missing and we have an odd number of class intervals hence, we will assume the middle-Class Mark as our Assumed Mean(A).
Step 3: Now we will apply the general formula to calculate the mean
Now, Let's see the detailed solution:
Class interval | Number of children (fi) | Mid-point (xi) | fixi |
|---|---|---|---|
11-13 | 7 | 12 | 84 |
13-15 | 6 | 14 | 84 |
15-17 | 9 | 16 | 144 |
17-19 | 13 | 18 = A | 234 |
19-21 | f | 20 | 20f |
21-23 | 5 | 22 | 110 |
23-25 | 4 | 24 | 96 |
Total | ∑ fi = 44 + f | Sum ∑fixi = 752 + 20f |
The mean formula is
Mean =
= (752 + 20f)/(44 + f)
Now substitute the values and equate to find the missing frequency (f)
⇒ 18 = (752 + 20f)/(44 + f)
⇒ 18(44 + f) = (752 + 20f)
⇒ 792 + 18f = 752 + 20f
⇒ 792 + 18f = 752 + 20f
⇒ 792 – 752 = 20f – 18f
⇒ 40 = 2f
⇒ f = 20
So, the missing frequency, f = 20.
Number of heartbeats per minute | 65-68 | 68-71 | 71-74 | 74-77 | 77-80 | 80-83 | 83-86 |
Number of Women | 2 | 4 | 3 | 8 | 7 | 4 | 2 |
Solution:
Step 1: Let us find out the Class Mark (xi) for the following class intervals by using the formula
Class Mark = (Upper class Limit + Lower Class Limit)/2
Step 2: In this case, the value of mid-point (xi) is very large, so let us assume the mean value, A = 75.5 and class size is h = 3.
di = (xi – A)
=> di = (xi – 75.5)
Step 3: Now we will apply the Assumed Mean Formula to calculate the mean
Now, Let's see the detailed solution:
Class Interval | Number of women (fi) | Mid-point (xi) | di = (xi – 75.5) | fidi |
|---|---|---|---|---|
65-68 | 2 | 66.5 | -9 | -18 |
68-71 | 4 | 69.5 | -6 | -24 |
71-74 | 3 | 72.5 | -3 | -9 |
74-77 | 8 | 75.5 = A | 0 | 0 |
77-80 | 7 | 78.5 | 3 | 21 |
80-83 | 4 | 81.5 | 6 | 24 |
83-86 | 2 | 84.5 | 9 | 18 |
Sum ∑fi = 30 | Sum ∑fiui = 12 |
Mean =
= 75.5 + (12/30)
= 75.5 + 2/5
= 75.5 + 0.4
= 75.9
Therefore, the mean heartbeats per minute for these women is 75.9
Number of Mangoes | 50-52 | 53-55 | 56-58 | 59-61 | 62-64 |
Number of Boxes | 15 | 110 | 135 | 115 | 25 |
Solution:
Step 1: In the above table we find that the class intervals are not continuous and hence to make them a continuous set of data we add 0.5 to the upper limit and subtract 0.45 from the lower limit as the gap between two intervals is 1. Then find the Mid Point by using the formula
Class Mark = (Upper class Limit + Lower Class Limit)/2
Step 2: In this case, let us assume the mean value, A = 57 and class size is h = 3.
Step 3: Since the frequency values are big, hence we are using the STEP-DEVIATION METHOD.
Now, Lets see the detailed solution:
Class Interval | Number of boxes (fi) | Mid-point (xi) | di = xi – A | ui=(xi – A)/h | fiui |
|---|---|---|---|---|---|
49.5-52.5 | 15 | 51 | -6 | -2 | -30 |
52.5-55.5 | 110 | 54 | -3 | -1 | -110 |
55.5-58.5 | 135 | 57 =A | 0 | 0 | 0 |
58.5-61.5 | 115 | 60 | 3 | 1 | 115 |
61.5-64.5 | 25 | 63 | 6 | 2 | 50 |
Sum ∑fi = 400 | Sum ∑fiui = 25 |
Mean =
= 57 + 3 * (25/400)
= 57 + 0.1875
= 57.19
Therefore, the mean number of mangoes kept in a packing box is 57.19
Daily Expenditure (in ₹) | 100-150 | 150-200 | 200-250 | 250-300 | 300-350 |
Number of Households | 4 | 5 | 12 | 2 | 2 |
Solution:
Step 1: Let us find out the Class Mark (xi) for the following class intervals by using the formula
Class Mark = (Upper class Limit + Lower Class Limit)/2
Step 2: In this case, the value of mid-point (xi) is very large, so let us assume the mean value, A = 225 and class size is h = 50.
di = (xi – A)
=> di = (xi – 225)
ui = (xi – A)/h
=> ui = (xi – 225)/50
Step 3: Now we will apply the Step Deviation Formula to calculate the mean
Now, Let's see the detailed solution:
Class Interval | Number of households (fi) | Mid-point (xi) | di = xi – A | ui = di/50 | fiui |
|---|---|---|---|---|---|
100-150 | 4 | 125 | -100 | -2 | -8 |
150-200 | 5 | 175 | -50 | -1 | -5 |
200-250 | 12 | 225 = A | 0 | 0 | 0 |
250-300 | 2 | 275 | 50 | 1 | 2 |
300-350 | 2 | 325 | 100 | 2 | 4 |
Sum ∑fi = 25 | Sum ∑fiui = -7 |
Mean =
= 225 + 50 (-7/25)
= 225 - 14
= 211
Therefore, the mean daily expenditure on food is ₹211
Concentration of SO2 (in ppm) | Frequency |
|---|---|
0.00-0.04 | 4 |
0.04-0.08 | 9 |
0.08-0.12 | 9 |
0.12-0.16 | 2 |
0.16-0.20 | 4 |
0.20-0.24 | 2 |
Solution:
Step 1: Let us find out the Class Mark (xi) for the following class intervals by using the formula
Class Mark = (Upper class Limit + Lower Class Limit)/2
Step 2: Now, we will multiply the classmark with the number of times they have occurred, i.e, with the frequency.
Step 3: Now we will apply the general formula to calculate the mean
Now, Let's see the detailed solution:
Concentration of SO2 (in ppm) | Frequency (fi) | Mid-point (xi) | fixi |
|---|---|---|---|
0.00-0.04 | 4 | 0.02 | 0.08 |
0.04-0.08 | 9 | 0.06 | 0.54 |
0.08-0.12 | 9 | 0.10 | 0.90 |
0.12-0.16 | 2 | 0.14 | 0.28 |
0.16-0.20 | 4 | 0.18 | 0.72 |
0.20-0.24 | 2 | 0.22 | 0.44 |
Sum ∑fi = 30 | Sum ∑fixi = 2.96 |
The formula to find out the mean is
Mean =
= 2.96/30
= 0.099 ppm
Therefore, the mean concentration of SO2 in the air is 0.099 ppm.
Number of Days | 0-6 | 6-10 | 10-14 | 14-20 | 20-28 | 28-38 | 38-40 |
Number of Students | 11 | 10 | 7 | 4 | 4 | 3 | 1 |
Solution:
Step 1: Let us find out the Class Mark (xi) for the following class intervals by using the formula
Class Mark = (Upper class Limit + Lower Class Limit)/2
Step 2: Now, we will multiply the classmark with the number of times they have occurred, i.e, with the frequency.
Step 3: Now we will apply the general formula to calculate the mean
Now, Let's see the detailed solution:
Class Interval | Frequency (fi) | Mid-point (xi) | fixi |
|---|---|---|---|
0-6 | 11 | 3 | 33 |
6-10 | 10 | 8 | 80 |
10-14 | 7 | 12 | 84 |
14-20 | 4 | 17 | 68 |
20-28 | 4 | 24 | 96 |
28-38 | 3 | 33 | 99 |
38-40 | 1 | 39 | 39 |
Sum ∑fi = 40 | Sum ∑fixi = 499 |
The mean formula is,
Mean =
= 499/40
= 12.48 days
Therefore, the mean number of days a student was absent = 12.48.
Literacy rate (in %) | 45-55 | 55-65 | 65-75 | 75-85 | 85-95 |
Number of Cities | 3 | 10 | 11 | 8 | 3 |
Solution:
Step 1: Let us find out the Class Mark (xi) for the following class intervals by using the formula
Class Mark = (Upper class Limit + Lower Class Limit)/2
Step 2: In this case, the value of mid-point (xi) is very large, so let us assume the mean value, A = 70 and class size is h = 10.
di = (xi – A)
=> di = (xi – 70)
ui = (xi – A)/h
=> ui = (xi – 70)/10
Step 3: Now we will apply the Step Deviation Formula to calculate the mean
Now, Let's see the detailed solution:
Class Interval | Frequency (fi) | Class Mark(xi) | di = xi – a | ui = di/h | fiui |
|---|---|---|---|---|---|
45-55 | 3 | 50 | -20 | -2 | -6 |
55-65 | 10 | 60 | -10 | -1 | -10 |
65-75 | 11 | 70 = A | 0 | 0 | 0 |
75-85 | 8 | 80 | 10 | 1 | 8 |
85-95 | 3 | 90 | 20 | 2 | 6 |
Sum ∑fi = 35 | Sum ∑fiui = -2 |
So,
Mean =
= 70 + (-2/35) × 10
= 69.42
Therefore, the mean literacy rate = 69.42%.
| Age (in years) | 5-15 | 15-25 | 25-35 | 35-45 | 45-55 | 55-65 |
| Number of patients | 6 | 11 | 21 | 23 | 14 | 5 |
Solution:
The greatest frequency in the given table is 23, so the modal class = 35 – 45,
l = 35,
Class width = 10, and the frequencies are
fm = 23, f1 = 21 and f2 = 14
Now, we find the mode using the given formula
Mode =
On substituting the values in the formula, we get
Mode =
= 35 + (20/11) = 35 + 1.8
= 36.8
Hence, the mode of the given data is 36.8 year
Now, we find the mean. So for that first we need to find the midpoint.
xi = (upper limit + lower limit)/2
Class Interval Frequency (fi) Mid-point (xi) fixi 5-15 6 10 60 15-25 11 20 220 25-35 21 30 630 35-45 23 40 920 45-55 14 50 700 55-65 5 60 300 Sum fi = 80 Sum fixi = 2830 Mean = = ∑fixi /∑fi
= 2830/80
= 35.37 years
| Lifetime (in hours) | 0-20 | 20-40 | 40-60 | 60-80 | 80-100 | 100-120 |
| Frequency | 10 | 35 | 52 | 61 | 38 | 29 |
Solution:
According to the given question
The modal class is 60 – 80
l = 60, and the frequencies are
fm = 61, f1 = 52, f2 = 38 and h = 20
Now, we find the mode using the given formula
Mode =
On substituting the values in the formula, we get
Mode =
=
= 60 + 45/8 = 60 + 5.625
Hence, the modal lifetime of the components is 65.625 hours.
| Expenditure | Number of families |
| 1000-1500 | 24 |
| 1500-2000 | 40 |
| 2000-2500 | 33 |
| 2500-3000 | 28 |
| 3000-3500 | 30 |
| 3500-4000 | 22 |
| 4000-4500 | 16 |
| 4500-5000 | 7 |
Solution:
According to the question
Modal class = 1500-2000,
l = 1500,and the frequencies are
fm = 40 f1 = 24, f2 = 33 and
h = 500
Now, we find the mode using the given formula
Mode =
On substituting the values in the formula, we get
Mode =
=
= 1500 + 8000/23 = 1500 + 347.83
So, the modal monthly expenditure of the families is 1847.83 Rupees
Now, we find the mean. So for that first we need to find the midpoint.
xi = (upper limit + lower limit)/2
Let us considered a mean, A be 2750
Class Interval fi xi di = xi – a ui = di/h fiui 1000-1500 24 1250 -1500 -3 -72 1500-2000 40 1750 -1000 -2 -80 2000-2500 33 2250 -500 -1 -33 2500-3000 28 2750 0 0 0 3000-3500 30 3250 500 1 30 3500-4000 22 3750 1000 2 44 4000-4500 16 4250 1500 3 48 4500-5000 7 4750 2000 4 28 fi = 200 fiui = -35 Mean =
On substituting the values in the given formula
=
= 2750 - 87.50
= 2662.50
Hence, the mean monthly expenditure of the families is 2662.50 Rupees
| No of Students per teacher | Number of states / U.T |
| 15-20 | 3 |
| 20-25 | 8 |
| 25-30 | 9 |
| 30-35 | 10 |
| 35-40 | 3 |
| 40-45 | 0 |
| 45-50 | 0 |
| 50-55 | 2 |
Solution:
According to the question
Modal class = 30 – 35,
l = 30,
Class width (h) = 5, and the frequencies are
fm = 10, f1 = 9 and f2 = 3
Now, we find the mode using the given formula
Mode =
On substituting the values in the formula, we get
Mode =
= 30 + 5/8 = 30 + 0.625
= 30.625
Hence, the mode of the given data is 30.625
Now, we find the mean. So for that first we need to find the midpoint.
xi = (upper limit + lower limit)/2
Class Interval Frequency (fi) Mid-point (xi) fixi 15-20 3 17.5 52.5 20-25 8 22.5 180.0 25-30 9 27.5 247.5 30-35 10 32.5 325.0 35-40 3 37.5 112.5 40-45 0 42.5 0 45-50 0 47.5 0 50-55 2 52.5 105.5 Sum fi = 35 Sum fixi = 1022.5 Mean =
= 1022.5/35
= 29.2
Hence, the mean is 29.2
| Run Scored | Number of Batsman |
|---|---|
| 3000-4000 | 4 |
| 4000-5000 | 18 |
| 5000-6000 | 9 |
| 6000-7000 | 7 |
| 7000-8000 | 6 |
| 8000-9000 | 3 |
| 9000-10000 | 1 |
| 10000-11000 | 1 |
Solution:
According to the question
Modal class = 4000 – 5000,
l = 4000,
class width (h) = 1000, and the frequencies are
fm = 18, f1 = 4 and f2 = 9
Now, we find the mode using the given formula
Mode =
On substituting the values in the formula, we get
Mode =
Mode = 4000 + 14000/23 = 4000 + 608.695
= 4608.695
Hence, the mode of the given data is 4608.7 runs
| Number of cars | Frequency |
|---|---|
| 0-10 | 7 |
| 10-20 | 14 |
| 20-30 | 13 |
| 30-40 | 12 |
| 40-50 | 20 |
| 50-60 | 11 |
| 60-70 | 15 |
| 70-80 | 8 |
Solution:
According to the question
Modal class = 40 – 50, l = 40,
Class width (h) = 10, and the frequencies are
fm = 20, f1 = 12 and f2 = 11
Now, we find the mode using the given formula
Mode =
On substituting the values in the formula, we get
Mode =
Mode = 40 + 80/17 = 40 + 4.7 = 44.7
Hence, the mode of the given data is 44.7 cars
| Monthly consumption(in units) | No. of customers |
|---|---|
| 65-85 | 4 |
| 85-105 | 5 |
| 105-125 | 13 |
| 125-145 | 20 |
| 145-165 | 14 |
| 165-185 | 8 |
| 185-205 | 4 |
Solution:
Total number of consumer n = 68
n/2 =34
So, the median class is 125-145 with cumulative frequency = 42
Here, l = 125, n = 68, Cf = 22, f = 20, h = 20
Now we find the median:
Median =
= 125 + 12 = 137
Hence, the median is 137
Now we find the mode:
Modal class = 125 - 145,
Frequencies are
f1 = 20, f0 = 13, f2 = 14 & h = 20
Mode =
On substituting the values in the given formula, we get
Mode =
= 125 + 140/13
= 125 + 10.77
= 135.77
Hence, the mode is 135.77
Now we find the mean:
Class Interval fi xi di = xi - a ui = di/h fiui 65-85 4 75 -60 -3 -12 85-105 5 95 -40 -2 -10 105-125 13 115 -20 -1 -13 125-145 20 135 0 0 0 145-165 14 155 20 1 14 165-185 8 175 40 2 16 185-205 4 195 60 3 12 Sum fi = 68 Sum fiui = 7 = 135 + 20(7/68)
= 137.05
Hence, the mean is 137.05
Now, on comparing the median, mean, and mode, we found that mean, median and mode are more/less equal in this distribution.
| Class Interval | Frequency |
|---|---|
| 0-10 | 5 |
| 10-20 | x |
| 20-30 | 20 |
| 30-40 | 15 |
| 40-50 | y |
| 50-60 | 5 |
| Total | 60 |
Solution:
According to the question
The total number of observations are n = 60
Median of the given data = 28.5
n/2 = 30
Median class is 20 – 30 with a cumulative frequency = 25 + x
Lower limit of median class, l = 20,
Cf = 5 + x,
f = 20 & h = 10
Now we find the median:
Median =
On substituting the values in the given formula, we get
28.5 =
8.5 = (25 - x)/2
17 = 25 - x
Therefore, x = 8
From the cumulative frequency, we can identify the value of x + y as follows:
60 = 5 + 20 + 15 + 5 + x + y
On substituting the values of x, we will find the value of y
60 = 5 + 20 + 15 + 5 + 8 + y
y = 60 - 53
y = 7
So the value of a is 8 and y is 7
| Age (in years) | Number of policyholder |
|---|---|
| Below 20 | 2 |
| Below 25 | 6 |
| Below 30 | 24 |
| Below 35 | 45 |
| Below 40 | 78 |
| Below 45 | 89 |
| Below 50 | 92 |
| Below 55 | 98 |
| Below 60 | 100 |
Solution:
According to the given question the table is
Class interval Frequency Cumulative frequency 15-20 2 2 20-25 4 6 25-30 18 24 30-35 21 45 35-40 33 78 40-45 11 89 45-50 3 92 50-55 6 98 55-60 2 100 Given data: n = 100 and n/2 = 50
Median class = 35 - 45
Then, l = 35, cf = 45, f = 33 & h = 5
Now we find the median:
Median =
On substituting the values in the given formula, we get
Median =
= 35 + 5(5/33)
= 35.75
Hence, the median age is 35.75 years.
| Length (in mm) | Number of leaves |
|---|---|
| 118-126 | 3 |
| 127-135 | 5 |
| 136-144 | 9 |
| 145-153 | 12 |
| 154-162 | 5 |
| 163-171 | 4 |
| 172-180 | 2 |
Solution:
The data in the given table are not continuous to reduce 0.5 in the lower limit and add 0.5 in the upper limit.
We get a new table:
Class Interval Frequency Cumulative frequency 117.5-126.5 3 3 126.5-135.5 5 8 135.5-144.5 9 17 144.5-153.5 12 29 153.5-162.5 5 34 162.5-171.5 4 38 171.5-180.5 2 40 From the given table
n = 40 and n/2 = 20
Median class = 144.5 - 153.5
l = 144.5,
cf = 17, f = 12 & h = 9
Now we find the median:
Median =
On substituting the values in the given formula, we get
Median =
= 144.5 + 9/4
= 146.75 mm
Hence, the median length of the leaves is 146.75 mm.
| Lifetime (in hours) | Number of lamps |
|---|---|
| 1500-2000 | 14 |
| 2000-2500 | 56 |
| 2500-3000 | 60 |
| 3000-3500 | 86 |
| 3500-4000 | 74 |
| 4000-4500 | 62 |
| 4500-5000 | 48 |
Solution:
According to the question
Class Interval Frequency Cumulative 1500-2000 14 14 2000-2500 56 70 2500-3000 60 130 3000-3500 86 216 3500-4000 74 290 4000-4500 62 352 4500-5000 48 400 n = 400 and n/2 = 200
Median class = 3000 – 3500
l = 3000, Cf = 130,
f = 86 & h = 500
Now we find the median:
Median =
On substituting the values in the given formula, we get
Median =
= 3000 + 35000/86 = 3000 + 406.97
= 3406.97
Hence, the median lifetime of the lamps is 3406.97 hours
| Number of letters | 1-4 | 4-7 | 7-10 | 10-13 | 13-16 | 16-19 |
| Number of surnames | 6 | 30 | 40 | 16 | 4 | 4 |
Solution:
According to the question
Class Interval Frequency Cumulative Frequency 1-4 6 6 4-7 30 36 7-10 40 76 10-13 16 92 13-16 4 96 16-19 4 100 n = 100 and n/2 = 50
Median class = 7 - 10
Therefore, l = 7, Cf = 36, f = 40 & h = 3
Now we find the median:
Median =
On substituting the values in the given formula, we get
Median =
Median = 7 + 42/40 = 8.05
Hence, the median is 8.05
Now we find the mode:
Modal class = 7 - 10,
Where, l = 7, f1 = 40, f0 = 30, f2 = 16 & h = 3
Mode =
On substituting the values in the given formula, we get
Mode =
= 7 + 30/34 = 7.88
Hence, the mode is 7.88
Now we find the mean:
Class Interval fi xi fixi 1-4 6 2.5 15 4-7 30 5.5 165 7-10 40 8.5 340 10-13 16 11.5 184 13-16 4 14.5 51 16-19 4 17.5 70 Sum fi = 100 Sum fixi = 825 Mean =
= 825/100 = 8.25
Hence, the mean is 8.25
| Weight(in kg) | 40-45 | 45-50 | 50-55 | 55-60 | 60-65 | 65-70 | 70-75 |
| Number of students | 2 | 3 | 8 | 6 | 6 | 3 | 2 |
Solution:
According to the question
Class Interval Frequency Cumulative frequency 40-45 2 2 45-50 3 5 50-55 8 13 55-60 6 19 60-65 6 25 65-70 3 28 70-75 2 30 n = 30 and n/2 = 15
Median class = 55 - 60
l = 55, Cf = 13, f = 6 & h = 5
Now we find the median:
Median =
On substituting the values in the given formula, we get
Median =
= 55 + 10/6 = 55 + 1.666
= 56.67
Hence, the median weight of the students is 56.67
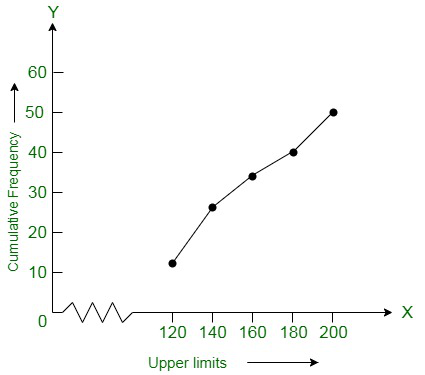
| Daily income in Rupees | 100-120 | 120-140 | 140-160 | 160-180 | 180-200 |
| Number of workers | 12 | 14 | 8 | 6 | 10 |
Solution:
According to the question, we convert the given distribution to a less than type cumulative frequency distribution,
Daily income Frequency Cumulative Frequency Less than 120 12 12 Less than 140 14 26 Less than 160 8 34 Less than 180 6 40 Less than 200 10 50 Now according to the table we plot the points that are corresponding to the ordered pairs (120, 12), (140, 26), (160, 34), (180, 40), and (200, 50) on a graph paper. Here x-axis represents the upper limit and y-axis represent the frequency. The curve obtained from the graph is known as less than type ogive curve.
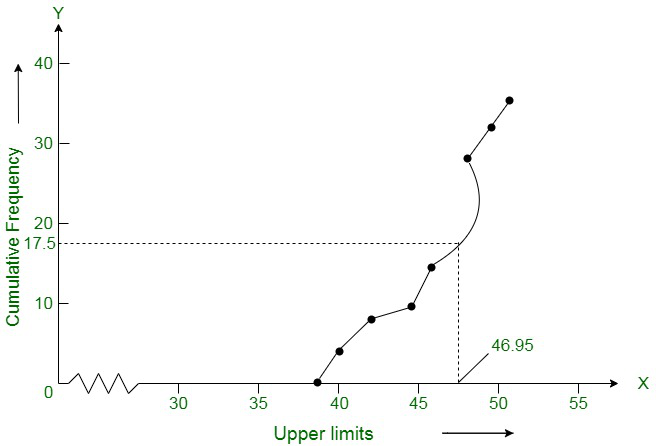
| Weight in kg | Number of students |
|---|---|
| Less than 38 | 0 |
| Less than 40 | 3 |
| Less than 42 | 5 |
| Less than 44 | 9 |
| Less than 46 | 14 |
| Less than 48 | 28 |
| Less than 50 | 32 |
| Less than 52 | 35 |
Solution:
According to the given table, we get the points (38, 0), (40, 3), (42, 5), (44, 9), (46, 14), (48, 28), (50, 32) and (52, 35). Now using these points we draw an ogive, where the x-axis represents the upper limit and y-axis represents the frequency. The curve obtained is known as less than type ogive.
👁 Class 10 NCERT Chapter 14 Exercise 14.4 Solution
Now, locate the point 17.5 on the y-axis and draw a line parallel to the x-axis cutting the curve at a point. From this point, now we draw a perpendicular line to the x-axis and the intersection point which is perpendicular to x-axis is the median of the given data. After, locating point now we create a table to find the mode:
Class interval Number of students(Frequency) Cumulative Frequency Less than 38 0 0 Less than 40 3 - 0 = 3 3 Less than 42 5 - 3 = 2 8 Less than 44 9 - 5 = 4 9 Less than 46 14 - 9 = 5 14 Less than 48 28 - 14 = 14 28 Less than 50 32 - 28 = 4 32 Less than 52 35 - 22 = 3 35 The class 46 – 48 has the maximum frequency, hence, this is the modal class
l = 46, h = 2, f1 = 14, f0 = 5 and f2 = 4
Now we find the mode:
Mode =
On substituting the values in the given formula, we get
= 46 + 0.95 = 46.95
Hence, the mode is verified.
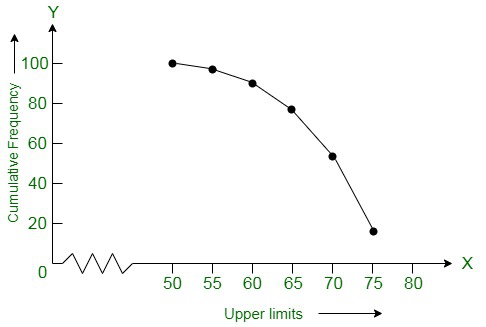
| Production Yield | 50-55 | 55-60 | 60-65 | 65-70 | 70-75 | 75-80 |
| Number of farms | 2 | 8 | 12 | 24 | 38 | 16 |
Solution:
According to the question, we change the distribution to a more than type distribution.
Production Yield (kg/ha) Number of farms More than or equal to 50 100 More than or equal to 55 100 - 2 = 98 More than or equal to 60 98 - 8 = 90 More than or equal to 65 90 - 12 = 78 More than or equal to 70 78 - 24 = 54 More than or equal to 75 54 - 38 = 16 Now, according to the table we draw the ogive by plotting the points. Here, the a-axis represents the upper limit and y-axis represents the cumulative frequency. And the points are(50, 100), (55, 98), (60, 90), (65, 78), (70, 54) and (75, 16) on this graph paper. The graph obtained is known as more than type ogive curve.
Also Check: