 |
VOOZH | about |
|
VOOZH | about |
Matplotlib library is widely used for plotting graphs. In many graphs, we require to have a grid to improve readability. Grids are created by using grid() function in the Pyplot sublibrary. In this article, we will see how to add grid in Matplotlb.
Below are the ways by which we can see how to add grid in Matplotlib in Python:
add_gridspec()In this example, the code uses the Matplotlib library to create a scatter plot of y = x^2 with points generated using NumPy. The first part uses the pyplot interface to create a scatter plot and grid on the y-axis. The second part creates a figure and axis explicitly, sets ticks on both the x and y axes, plots the scatter graph, and specifies the default grid on the figure.
Output:
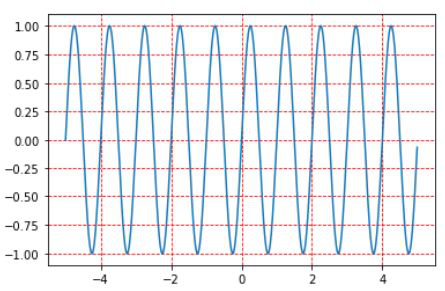
👁 ImageIn this example, the given code uses the Matplotlib library to create a line graph of the sine function. It defines an array 'x' from -5 to 5 with a step size of 0.01 and calculates 'y' as the sine of 2π times 'x'. The code then plots the line graph, sets a red dashed grid, and displays the plot.
Output:
👁 Imageadd_gridspec()In this example, the code uses Matplotlib and add_gridspec() to create a figure with a 2x2 grid of subplots. It defines three subplots (line plot, scatter plot, and bar plot) within this grid and plots data on each. Additionally, it adds a dashed grid to all subplots, enhancing visualization. Finally, the `plt.show()` command displays the figure with the configured subplots.
Output: