 |
VOOZH | about |
|
VOOZH | about |
In this article, we will learn How to set axes labels & limits in a Seaborn plot. Let's discuss some concepts first.
Here, In this article, the content goes from setting the axes labels, axes limits, and both at a time. In the end, you will be able to learn how to set axes labels & limits in a Seaborn plot.
Method 1: To set the axes label in the seaborn plot, we use matplotlib.axes.Axes.set() function from the matplotlib library of python.
Syntax: Axes.set(self, xlabel, ylabel, fontdict=None, labelpad=None, **kwargs)
Parameters:
- xlabel : str- The label text for the x-axis.
- ylabel : str- The label text for the y-axis.
- labelpad : scalar, optional, default: None
- **kwargs : Text properties
Returns: It will change the x-axis and y-axis labels.
Example: In this example, we will use single matplotlib.axes.Axes.set() function and change the label of the with a single call of this function, and we will pass both the xlabel and ylabel parameters in one go and this will change the user plot.
Output:
👁 Image
Method 2: To set the axes label in the seaborn plot, we use matplotlib.axes.Axes.set_ylabel() and matplotlib.axes.Axes.set_xlabel() function from the matplotlib library of python.
Syntax:
Axes.set_xlabel(self, xlabel, fontdict=None, labelpad=None, **kwargs)
Axes.set_ylabel(self, xlabel, fontdict=None, labelpad=None, **kwargs)
Parameters: This method accepts the following parameters.
- xlabel : This parameter is the label text.
- labelpad : This parameter is the spacing in points from the axes bounding box including ticks and tick labels.
Returns:This method does not return any value.
Example: In this example, we will use matplotlib.axes.Axes.set_ylabel() and matplotlib.axes.Axes.set_xlabel() function separately and pass the name of the label as the parameter to change the label of the plot.
Input:
Output:
👁 ImageFunctions for changing the limits:-
Syntax:
Axes.set_xlim(self, left=None, right=None, emit=True, auto=False, *, xmin=None, xmax=None)
Axes.set_ylim(self, bottom=None, top=None, emit=True, auto=False, *, ymin=None, ymax=None)
Parameters:
- bottom: This parameter is the bottom xlim/ylim in data coordinates
- top: This parameter is the top xlim/ylim in data coordinates
- emit: This parameter is used to notify observers of limit change.
- auto: This parameter is used to turn on autoscaling of the x-axis/y-axis.
- xmin, xmax, ymin, ymax: These parameters are equivalent to bottom and top and it is an error to pass both xmin/ymin and bottom or xmax/ymax and top.
Returns: bottom, top: This returns the new x-axis/y-axis limits in data coordinates.
Example:
Output:
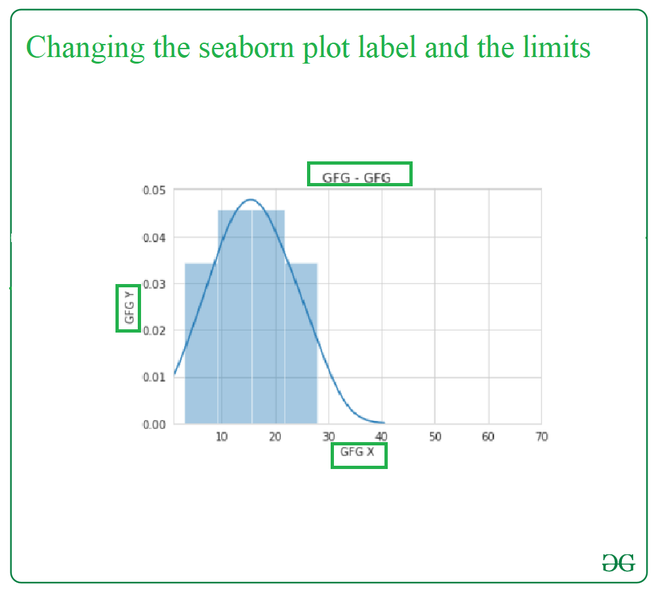
👁 ImageIn this particular example, we will be changing the label and the limit of the plot in a single code with the help of the suitable required functions of the python library.