 |
VOOZH | about |
|
VOOZH | about |
In this article, we will discuss how to visualize colors in an image using histogram in Python.
An image consists of various colors and we know that any color is a combination of Red, Green, Blue. So Image consists of Red, Green, Blue colors. So using Histogram we can visualize how much proportion we are having RGB colors in a picture.
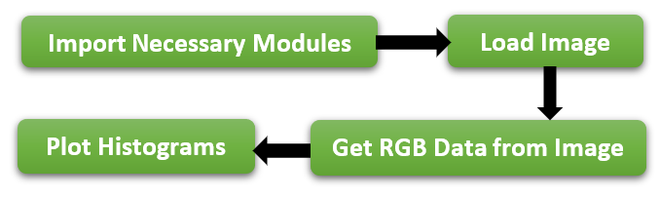
Histogram actually provides how frequently various colors occur in an image but not the location of color in an image. To visualize colors in the image we need to follow the below steps-
👁 ImageTo this Concept mainly we need 2 modules.
To load an image we need to use imread() method which is in the cv2 module. It accepts the image name as a parameter.
Syntax :
cv2.imread('imageName')
To get the RGB colors from the image, the cv2 module provides calchist method that accepts the image object, channel to get a specific color, mask, histogram size, and range.
Syntax:
cv2.calchist([imageObject], [channelValue], mask, [histSize], [low,high])
matplotlib provides the hist method which is used to draw the histogram on specified data.
Syntax:
matplotlib.hist(data,color="value")
Example:
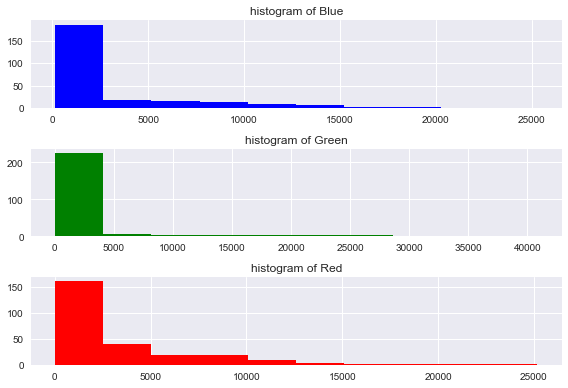
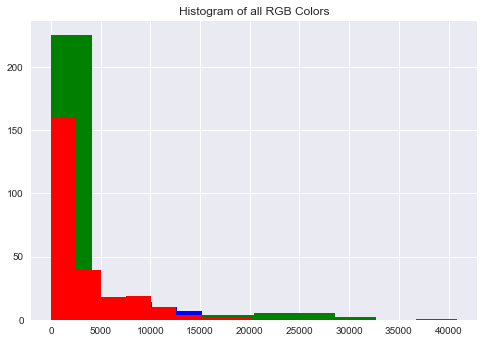
As per the above steps, First imported the required modules, and next we loaded an image using imread() method and using calcHist() method to get the RGB colors from Image and then plot the Histograms using the RGB data.
Output
👁 Image