 |
VOOZH | about |
|
VOOZH | about |
An Entity Relationship Diagram (ERD) is a graphical representation that shows how entities, such as people, objects or concepts, relate to each other within a system. ERDs are commonly used in database design to visualize the relationships between entities and their attributes.
ER diagram or ER model, is drawn to visually represent the relationships between entities in a database system. Some benefits of drawing ER diagrams for database design are:
A step-by-step process to draw an entity relation diagram (ERD) is:
Step 1. Identifying Entities: Determine the main objects you want to represent in the database. E.g., "students", "courses" or "products".
Step 2. Drawing Entities: Draw entities as rectangles and label them with their names.
Step 3. Defining Attributes: Identify the properties (attributes) of each entity. These attributes provide more details about an entity.
Step 4. Adding Attributes: Add attributes to the entities by either writing them inside the rectangle or connecting them using ovals and lines.
Step 5. Specifying Relationships: Create relationships between entities to show how they interact with each other. Relationships are usually verbs like teaches, studies or sells.
Step 6. Connecting Entities: Draw lines between the related entities to represent their connection.
Step 7. Specifying Cardinality: Indicate the minimum and maximum number of relationship instances associated with an entity using notations like crow's foot.
Step 8. Organizing ER Diagram: Organize all entities and relationships in a clean way for better readability and understanding.
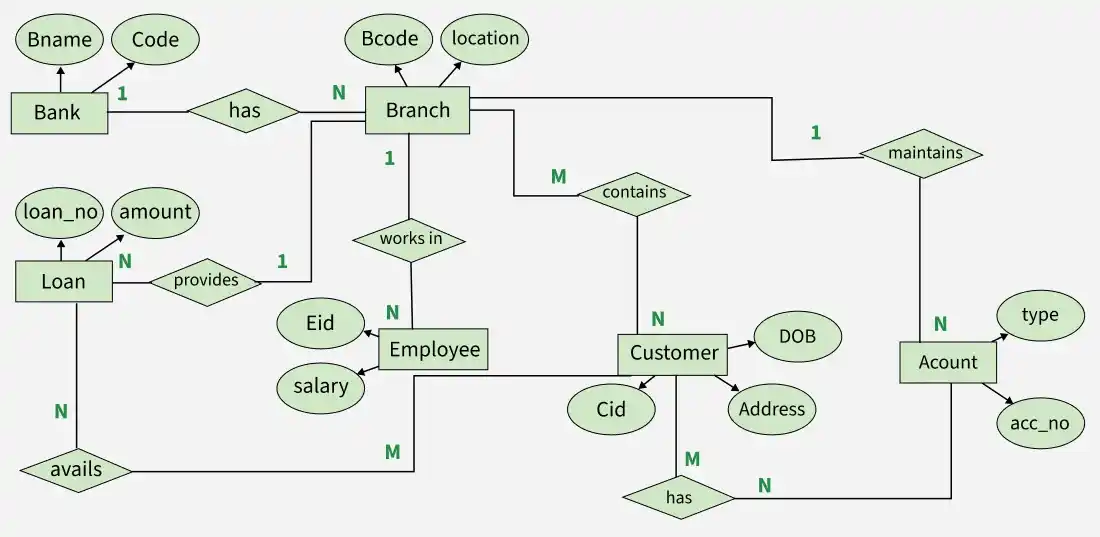
After learning how to draw an ER diagram, let’s create a demo using a bank example to understand its design and methods.
We will follow the steps mentioned above, to draw entity relationship diagram for bank.
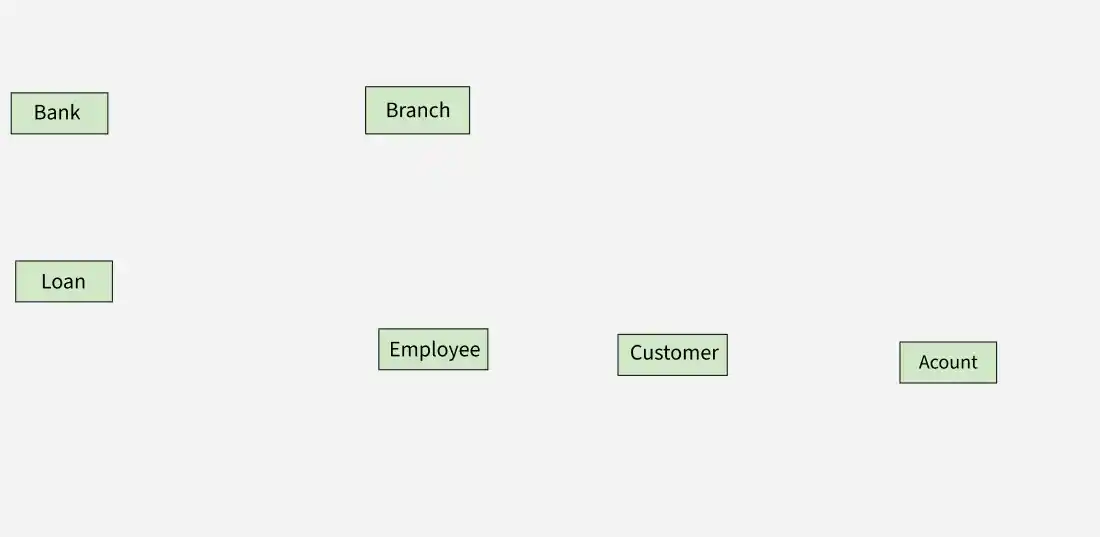
A real-world object with independent existence, either physical (house, person) or conceptual (course, job), is called an entity and is represented by a rectangle
Entities for Bank: Bank, Branch, Employee, customer, loan, account.
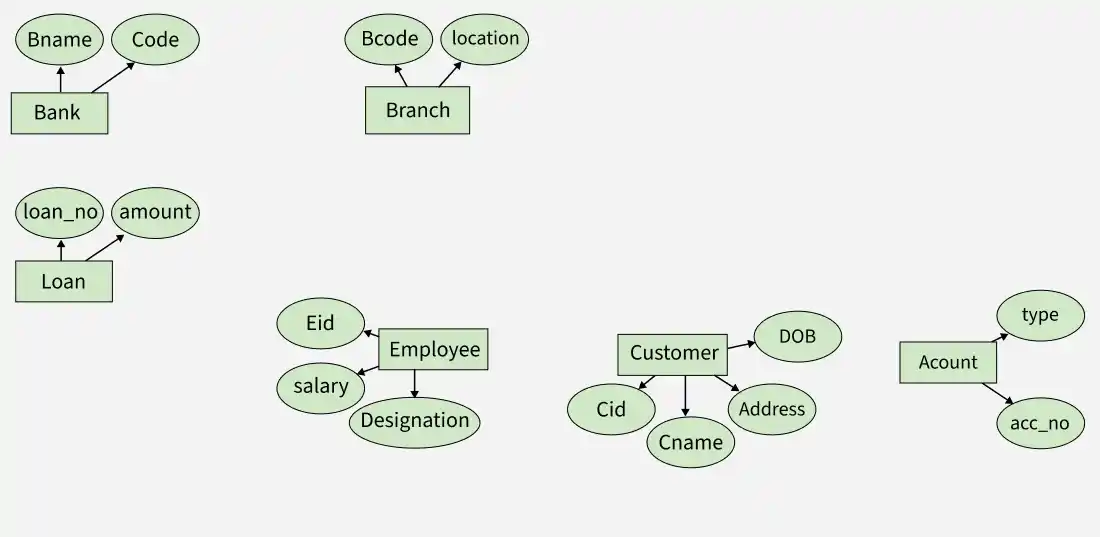
👁 er_diagram_4Attributes are the kind of properties that describe the entities. They are represented by ovals.
Attributes for Bank are:
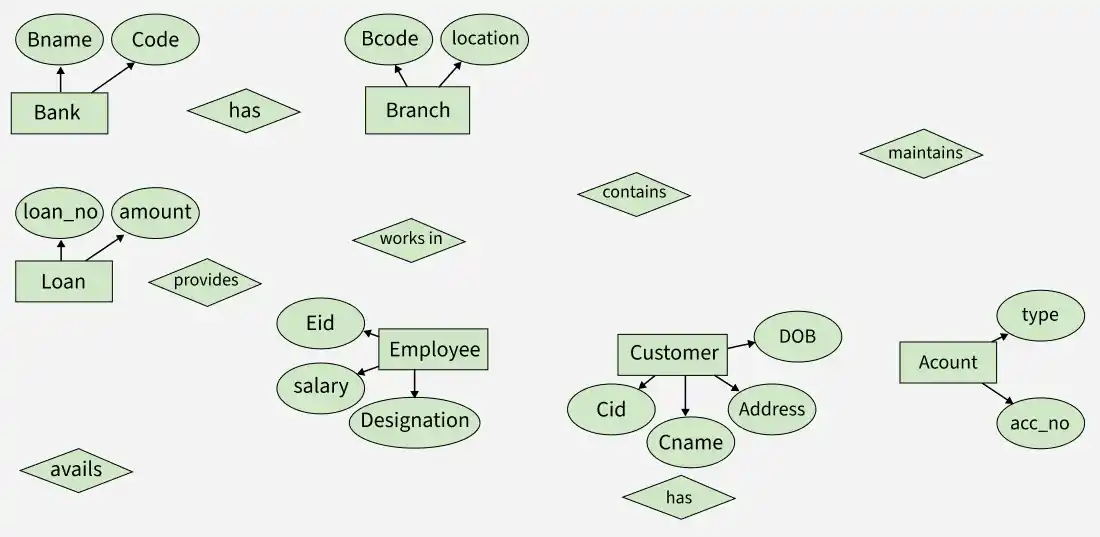
Entities have some relationships with each other. Relationships define how entities are associated with each other.
Let's Establishing Relationships between them are:
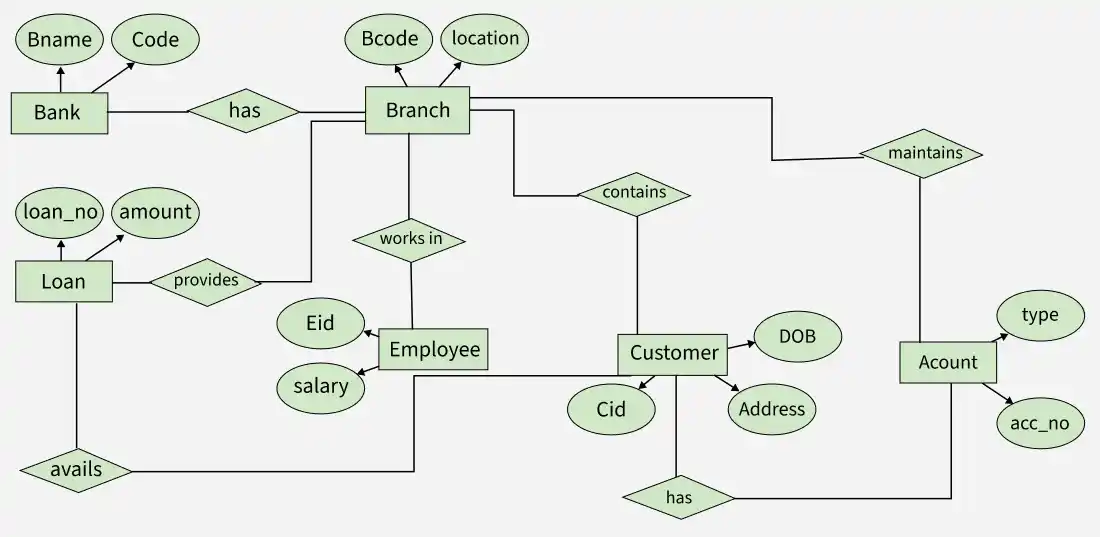
Cardinality defines the numerical constraints on the relationships between entities. It is a notation that tells the ERD reader whether there are one, many or some combination of those factors between each entity.
A One-to-One (1:1) relationship in an ERD means one entity in a table is linked to exactly one entity in another table. Examples:
A One-to-Many relationship means one entity in a table can be associated with multiple entities in another table. Examples:
A Many-to-One relationship means multiple entities in one table are linked to a single entity in another table. Examples:
A Many-to-Many relationship means multiple entities in one table are associated with multiple entities in another table. Examples:
Specify cardinality for Bank:
Primary keys are the unique identifier for each record in database table. It is denoted by an underline under the attribute name.
The below diagram is our final entity relationship diagram for bank with all entities, their attributes and the relationship between them with the PRIMARY KEY and Cardinality ratio.