 |
VOOZH | about |
|
VOOZH | about |
Bokeh is a powerful Python library for interactive data visualization. One of its notable features is the ability to customize plots extensively, including the appearance and functionality of toolbars. In this article, we’ll explore how to remove the toolbar from a Bokeh chart. This can be useful when you want to simplify the user interface or focus on the data itself without any additional controls.
Table of Content
Bokeh provides a variety of interactive tools for enhancing visualizations, such as zooming, panning, and hovering. These tools are accessible through the toolbar, which is typically displayed at the top of a Bokeh plot. The toolbar can be customized to include or exclude specific tools based on the needs of your visualization.
However, there are scenarios where you might want to remove the toolbar entirely. For instance, in a static report or when embedding plots in applications where interactivity is not required, having a toolbar might be unnecessary or distracting. This article will guide you through the process of removing the toolbar from Bokeh charts.
In Bokeh, the toolbar is controlled through the Toolbar class, which is part of the bokeh.models module. By default, Bokeh plots include a toolbar with various tools such as pan, zoom, and save. You can customize this toolbar using the toolbar parameter in the figure function or by modifying the toolbar directly.
To remove the toolbar, you'll need to configure the toolbar parameter correctly. This can be done by setting the toolbar parameter to None when creating the figure.
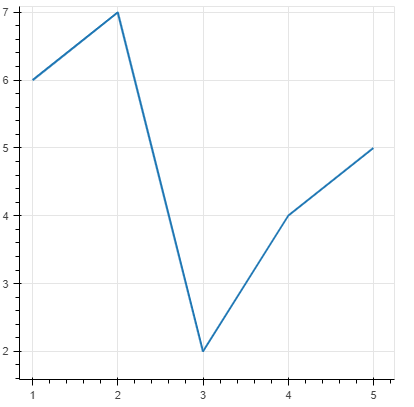
Let's start with a simple example of creating a Bokeh chart without a toolbar.
Output:
In this example, the toolbar_location parameter is set to None, which removes the toolbar from the plot.
If you want to keep the toolbar but make it less intrusive, Bokeh provides options to customize its visibility.
The autohide property allows the toolbar to be visible only when the mouse is inside the plot area. This is useful when you want to maintain interactivity without permanently displaying the toolbar.
Output:
With autohide set to True, the toolbar will only appear when the mouse is over the plot.
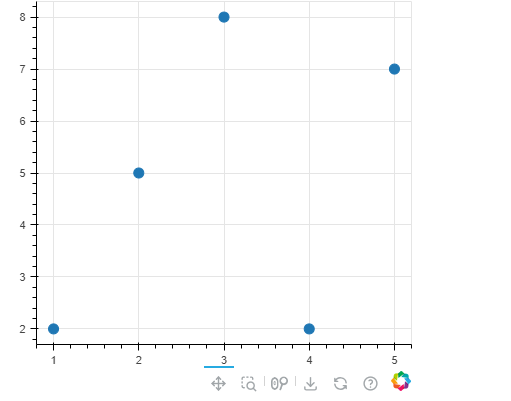
If you prefer to keep the toolbar but want to change its position, you can set the toolbar_location to "above", "below", "left", or "right".
Output:
This example positions the toolbar below the plot, which can be useful for certain layout designs.
Bokeh provides flexible options for managing the toolbar in your plots. Whether you want to remove it entirely, hide it conditionally, or customize its position, Bokeh's configuration options make it easy to tailor the toolbar to your specific needs. By understanding these options, you can create cleaner and more focused visualizations that meet your presentation requirements.